Network monitoring
SNMP
- เป็น protocol มาตรฐานบนอุปกรณ์เครือข่ายที่ใช้บริหารจัดการอุปกรณ์เช่นการอ่านค่าต่าง ๆ จากอุปกรณ์หรือส่งคำสั่งเพื่อเปลี่ยนแปลงค่าต่าง ๆ ของอุปกรณ์
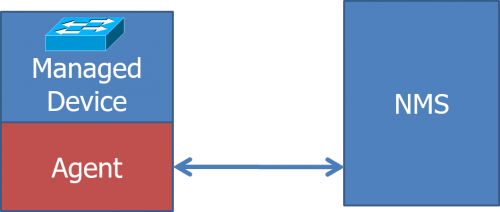
- โดยมี Network Management System(NMS) ติดตั้งซอฟท์แวร์สำหรับการจัดการ โดยติดต่อไปที่ SNMP agent ที่อยู่บนอุปกรณ์ที่เป็น Managed Device เช่น Router, Switch, Server host เป็นต้น
- SNMP Agent จะเปิดให้บริการที่ UDP Port 161
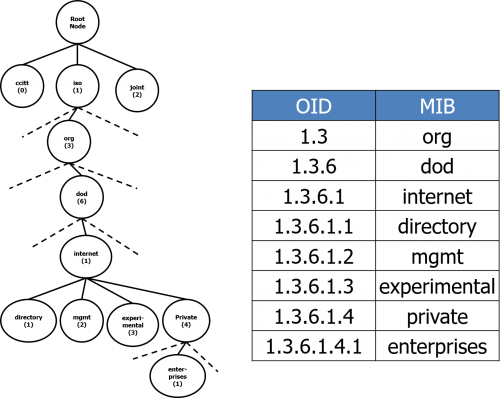
- การเข้าถึงข้อมูลต่าง ๆ บน SNMP Agent จะอ้างอิงผ่าน Object identifier(OID) หรือ Management Information Base(MIB) ซึ่งข้อมูลค่าต่าง ๆ จะถูกเก็บไว้เป็นโครงสร้าง tree และมี index เชื่อมกันในแต่ละกิ่งของข้อมูล
snmpd
- snmpd เป็น service ที่เป็น snmp agent บน Linux host (ในที่นี้ใช้ Ubuntu 14.04.4) ติดตั้งโดยใช้คำสั่ง
apt-get install snmp snmpd snmp-mibs-downloader
- แก้ไขไฟล์ /etc/snmp/snmpd.conf เพื่อกำหนดค่า community string และเปิดให้ remote NMS สามารถดึงข้อมูลได้
#agentAddress udp:127.0.0.1:161
agentAddress udp:161

rocommunity [community string]  default
- restart snmpd
service snmpd restart
การดึงข้อมูลจาก SNMP
- snmpget
ดึงข้อมูลจาก snmp agent ผ่าน OID หรือ MIB
รูปแบบคำสั่งเป็น snmpget [OPTIONS] AGENT OID [OID] …
โดยมี options ที่สำคัญคือ
-v : เวอร์ชั่นของ snmp {1, 2c, 3}
-c : community string
-On : แสดง OID เป็นตัวเลขแทน MIB
snmpget -v 2c -c [community string] [agent ip] sysName.0
SNMPv2-MIB::sysName.0 = STRING: ubuntu

snmpget -v 2c -c [community string] -On [agent ip] sysName.0
.1.3.6.1.2.1.1.5.0 = STRING: ubuntu
- snmpgetnext
ดึงข้อมูลแรกถัดจาก OID ที่ระบุ
snmpgetnext -v 2c -c [community string] [agent ip] .
SNMPv2-MIB::sysDescr.0 = STRING: Linux ubuntu 3.13.0-46-generic #79-Ubuntu SMP Tue Mar 10 20:06:50 UTC 2015 x86_64

snmpget -v 2c -c [community string] -On [agent ip] .
.1.3.6.1.2.1.1.1.0 = STRING: Linux ubuntu 3.13.0-46-generic #79-Ubuntu SMP Tue Mar 10 20:06:50 UTC 2015 x86_64
- snmpwalk
ดึงข้อมูลทั้งหมดถัดจาก OID ที่ระบุ
snmpwalk -v 2c -c qwerty localhost interface
IF-MIB::ifNumber.0 = INTEGER: 2
IF-MIB::ifIndex.1 = INTEGER: 1
IF-MIB::ifIndex.2 = INTEGER: 2
IF-MIB::ifDescr.1 = STRING: lo
IF-MIB::ifDescr.2 = STRING: eth0
IF-MIB::ifType.1 = INTEGER: softwareLoopback(24)
IF-MIB::ifType.2 = INTEGER: ethernetCsmacd(6)
IF-MIB::ifMtu.1 = INTEGER: 65536
IF-MIB::ifMtu.2 = INTEGER: 1500
IF-MIB::ifSpeed.1 = Gauge32: 10000000
IF-MIB::ifSpeed.2 = Gauge32: 1000000000
IF-MIB::ifPhysAddress.1 = STRING:
IF-MIB::ifPhysAddress.2 = STRING: 8:0:27:34:e1:8f
IF-MIB::ifAdminStatus.1 = INTEGER: up(1)
IF-MIB::ifAdminStatus.2 = INTEGER: up(1)
IF-MIB::ifOperStatus.1 = INTEGER: up(1)
IF-MIB::ifOperStatus.2 = INTEGER: up(1)
IF-MIB::ifLastChange.1 = Timeticks: (0) 0:00:00.00
- GUI snmp client
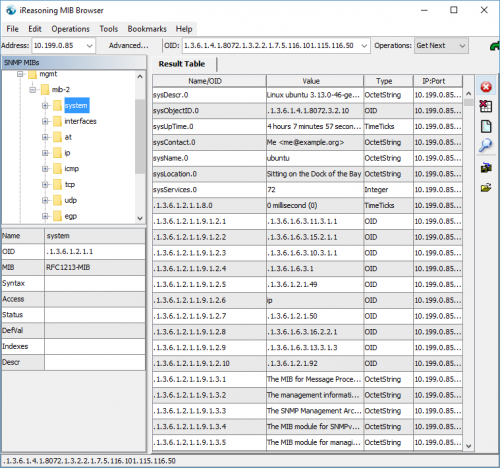
http://www.ireasoning.com Free MIB Browser
cacti
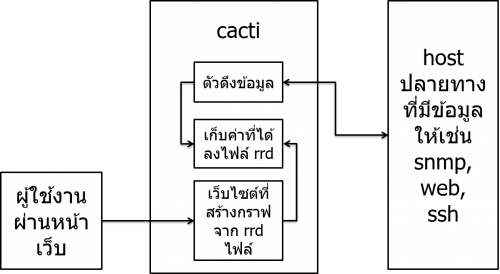
เป็นระบบ monitoring ที่ใช้ rrdtool เก็บข้อมูลและทำกราฟทำให้ทำงานได้เร็ว มี template หลากหลาย ดึงข้อมูลแบบปรับแต่งเองได้หลากหลาย มี plugins ให้ใช้งานและจัดการผู้ใช้ได้ http://cacti.net
ติดตั้ง cacti
apt-get install cacti

ให้ตั้งรหัสผ่านของ mysql root user
เลือก apache2 เป็น http server
ระบุรหัสผ่านของ mysql root
ตั้งค่ารหัสผ่านของ mysql cacti user
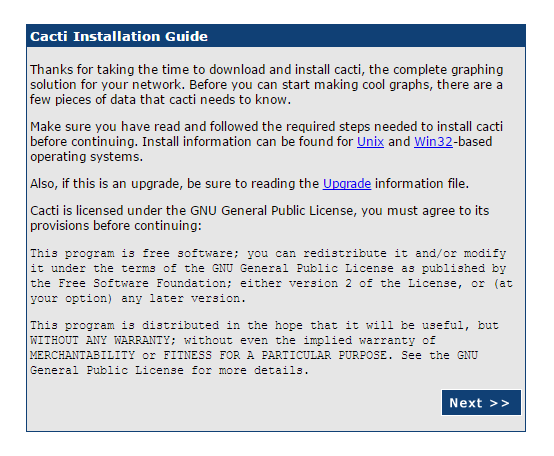
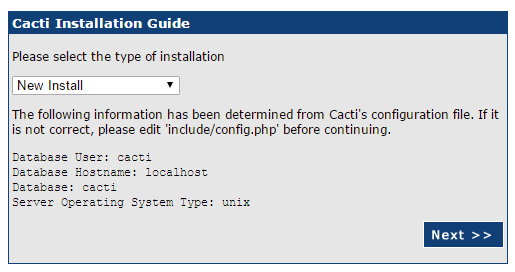
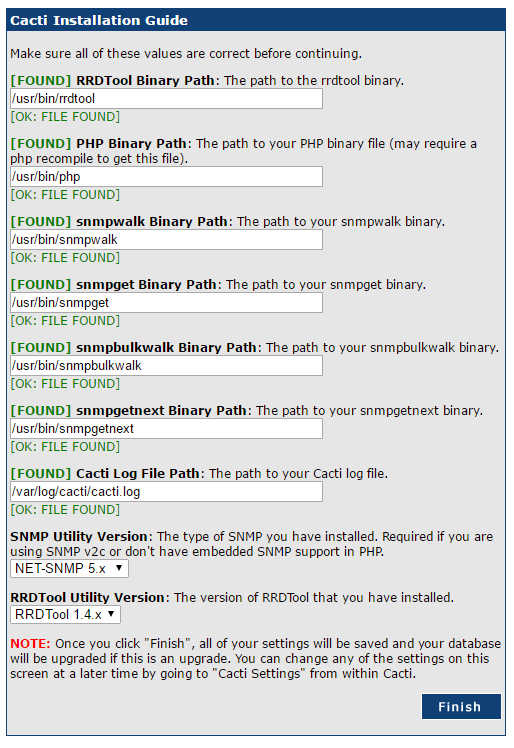
จากนั้นเรียก cacti ผ่าน browser http://[ip or hostname]/cacti และทำตามขั้นตอน ใช้ username และ password เริ่มต้นเป็น admin และตั้งค่ารหัสผ่านใหม่
เพิ่มอุปกรณ์ประเภท switch
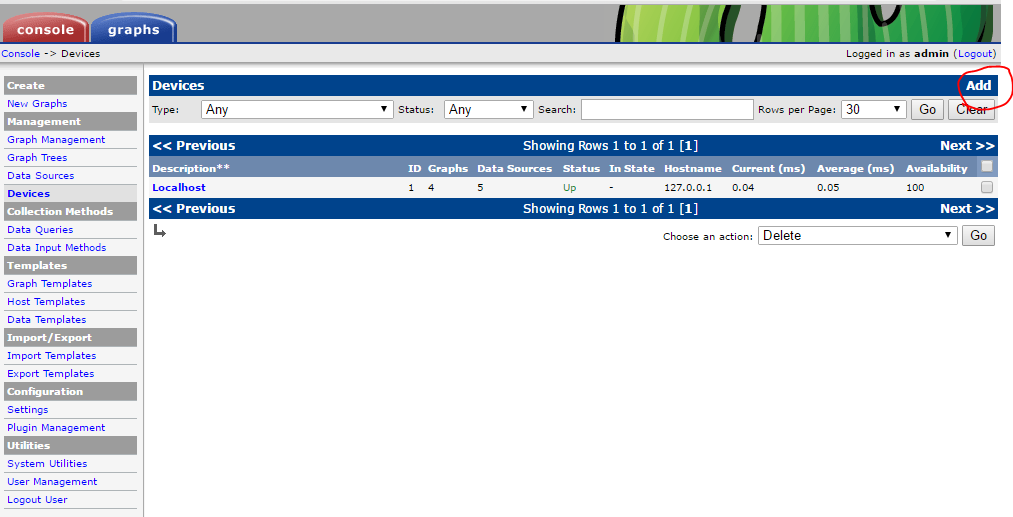
เพิ่มอุปกรณ์
- คลิก Add
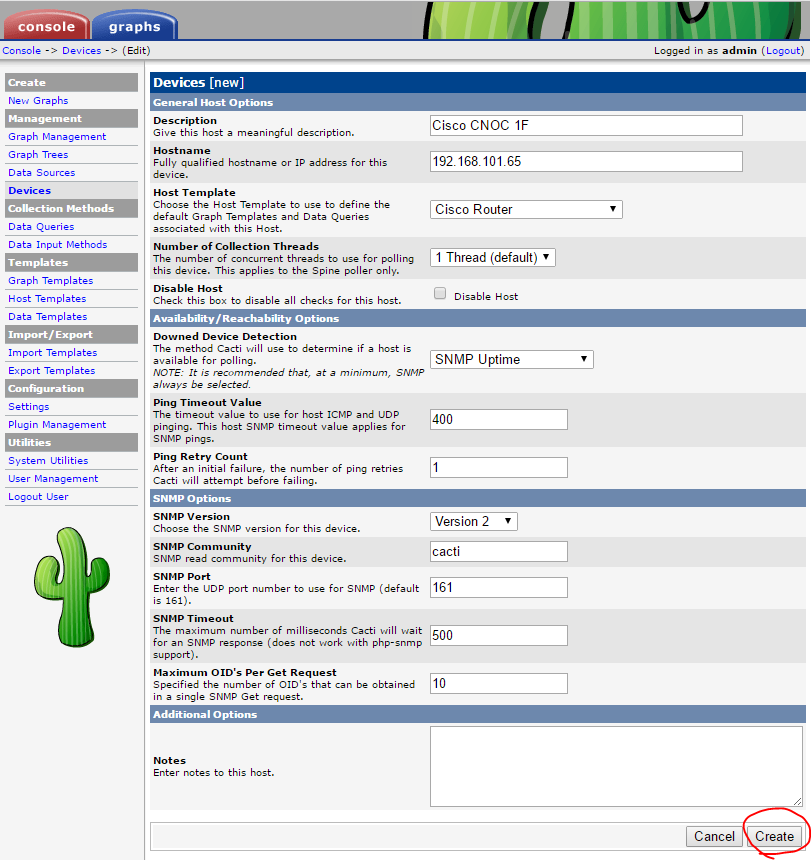
- ระบุข้อมูล SNMP ของอุปกรณ์ปลายทาง
สร้างกราฟ
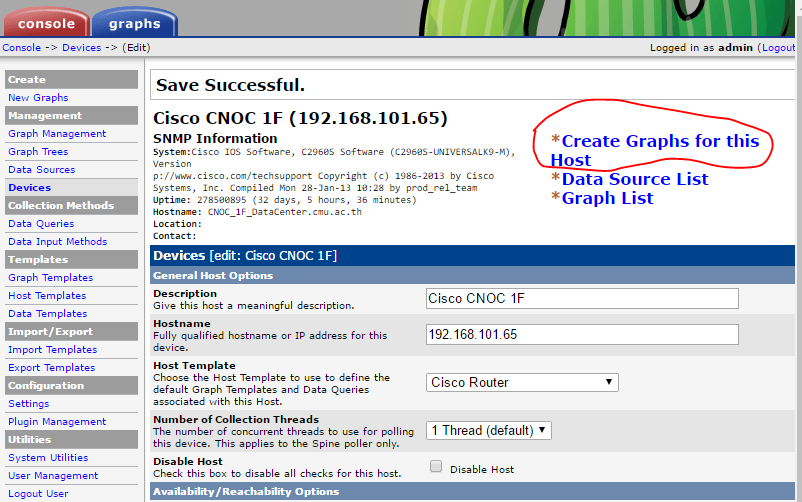
- คลิก Create Graphs for this host
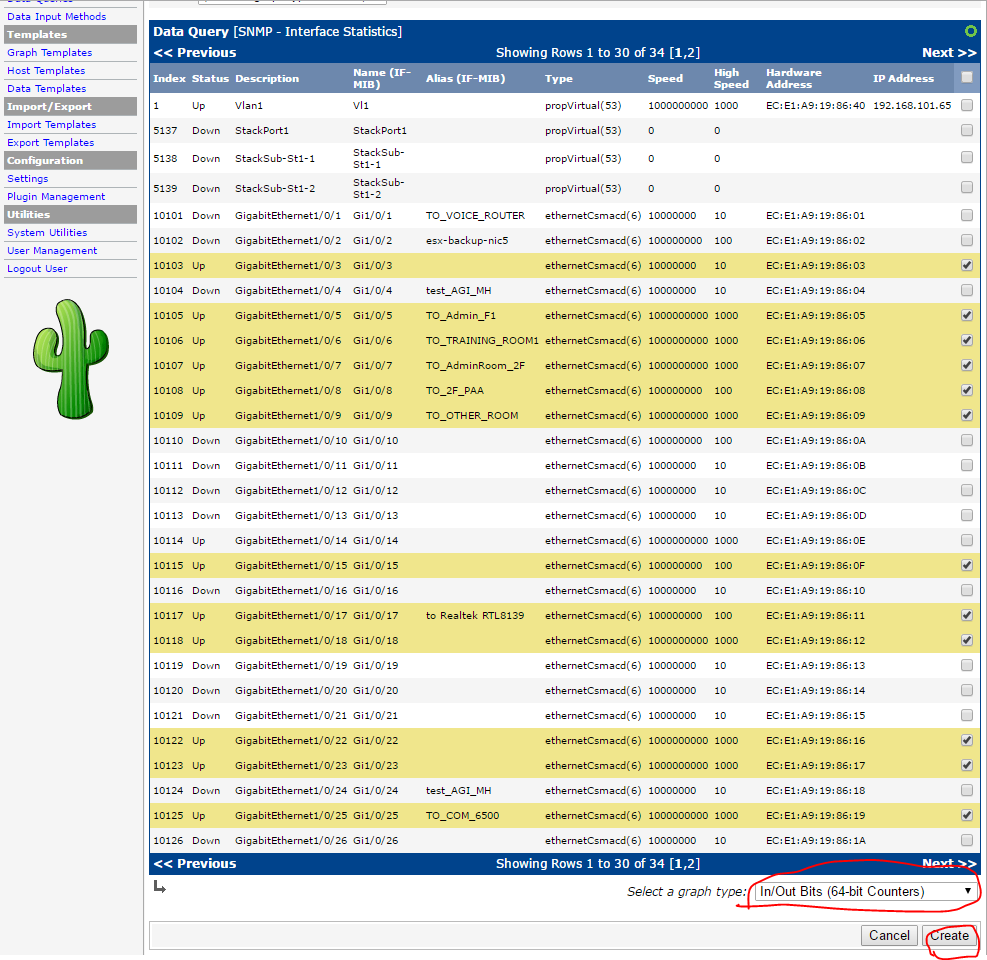
- เลือก 64bits counter สำหรับ Gigabits Interface
สร้าง graph tree
- คลิก Graph Trees แล้วคลิก Add
- ระบุรายละเอียด tree แล้วคลิก Create
เพิ่มอุปกรณ์ลงใน tree
- เลือกอุปกรณ์ที่จะเพิ่มลง tree แล้วเลือก Place on a Tree(ชื่อ tree) แล้วคลิก Go
- เลือกที่อยู่ใน tree แล้วคลิก Continue
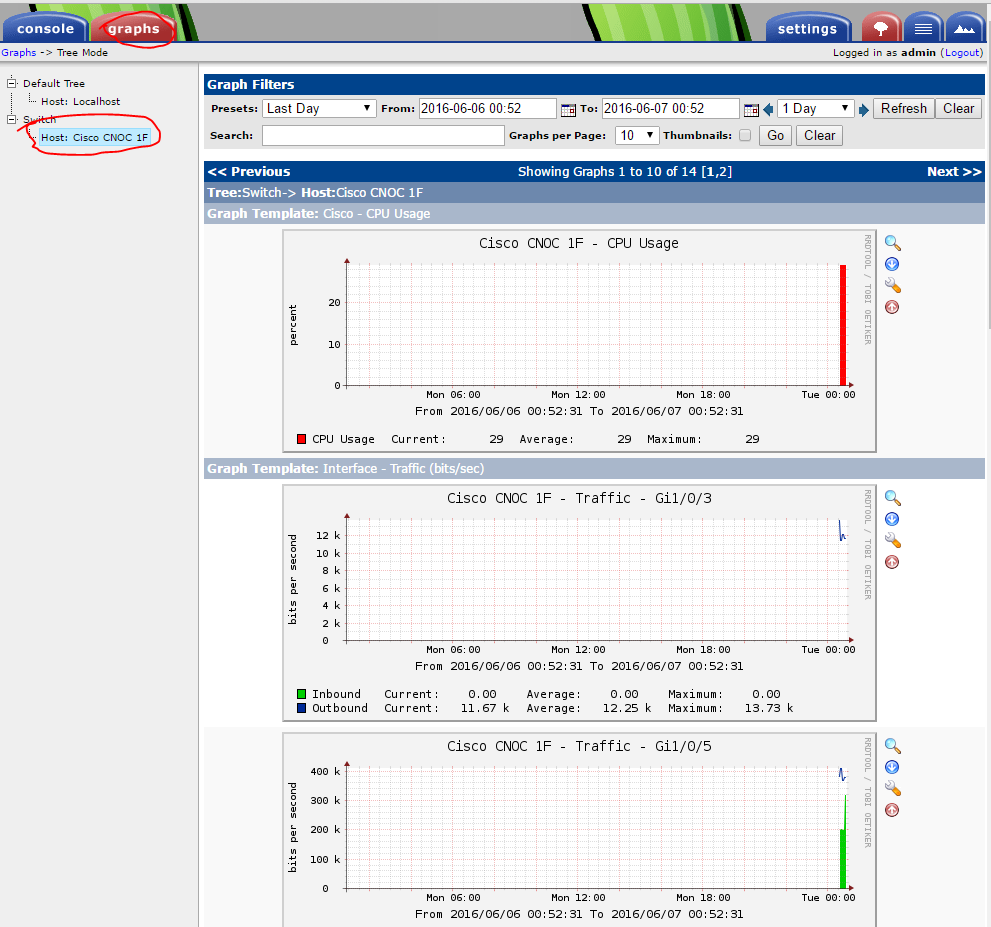
ดูกราฟ
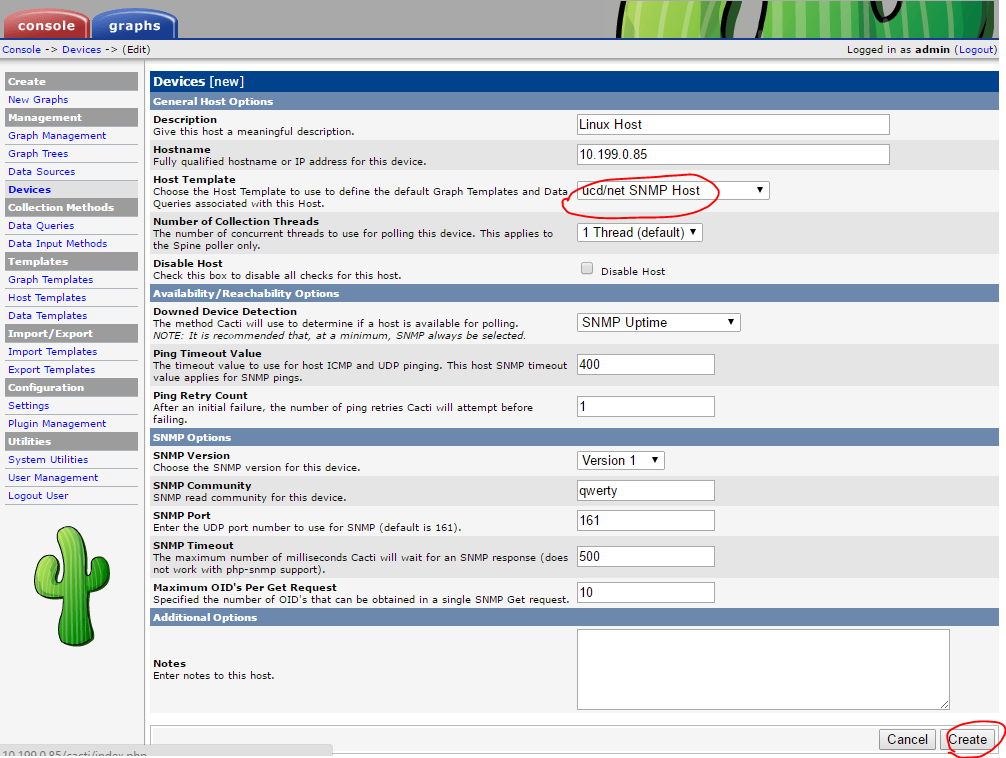
เพิ่มอุปกรณ์ประเภท Linux host
เพิ่มอุปกรณ์
- คลิก Add
- ระบุข้อมูล SNMP ของอุปกรณ์ปลายทาง
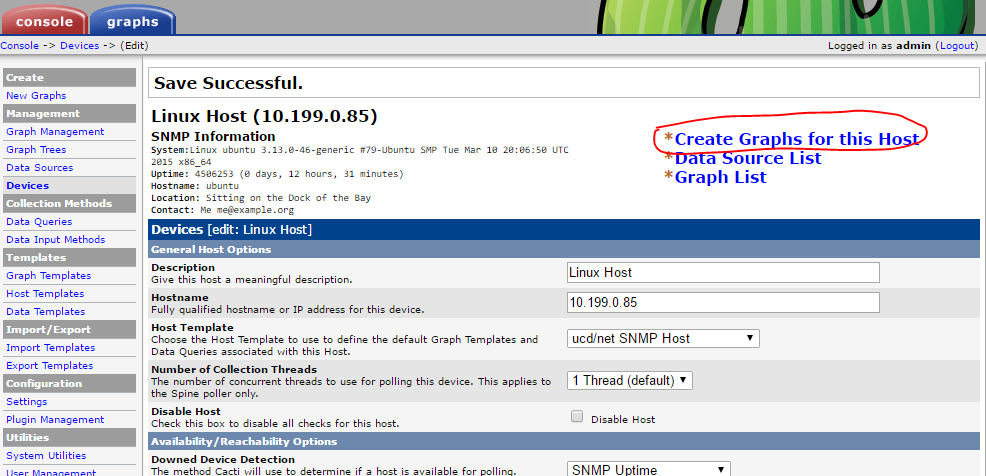
สร้างกราฟ
- คลิก Create Graphs for this host
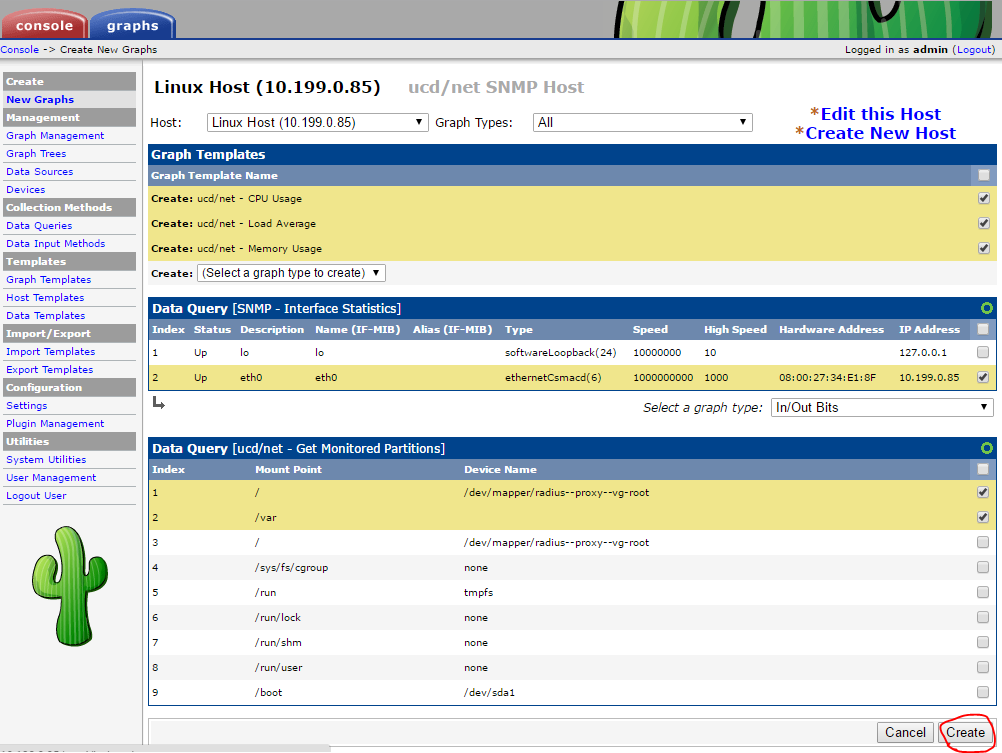
- เลือกสร้างกราฟที่ต้องการ
สร้าง graph tree
- คลิก Graph Trees แล้วคลิก Add
- ระบุรายละเอียด tree แล้วคลิก Create
เพิ่มอุปกรณ์ลงใน tree
- เลือกอุปกรณ์ที่จะเพิ่มลง tree แล้วเลือก Place on a Tree(ชื่อ tree) แล้วคลิก Go
- เลือกที่อยู่ใน tree แล้วคลิก Continue
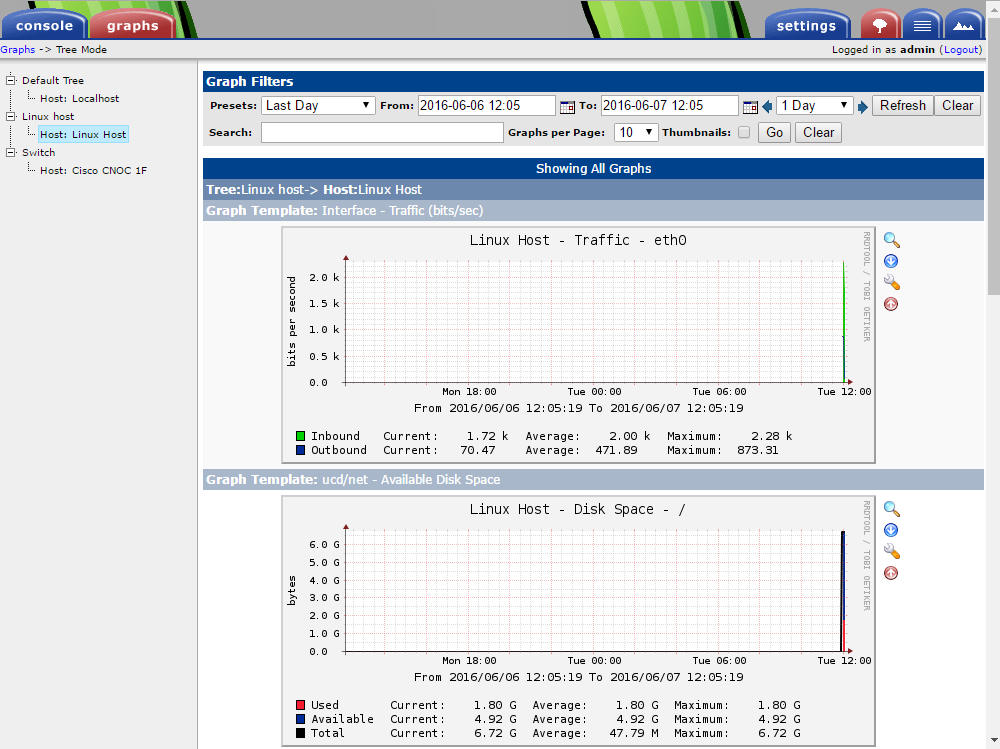
ดูกราฟ
เพิ่มอุปกรณ์ประเภท Windows
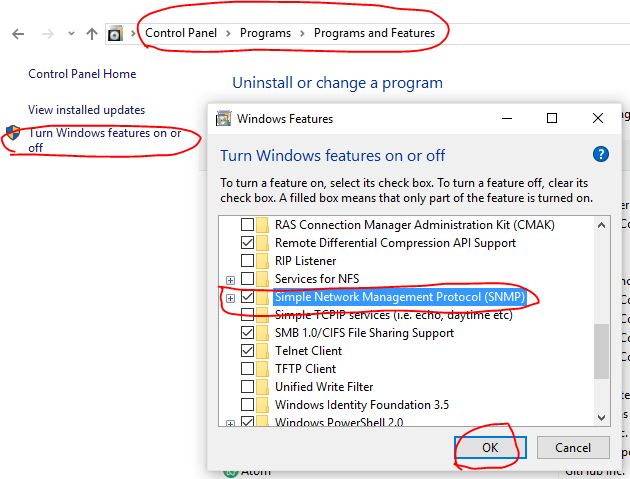
เปิด SNMP service บน Windows
- ยกตัวอย่าง Windows 10 ไปที่ Control Panel > Programs > Programs and Features > Turn Windows feature on or off แล้วเลือก SNMP
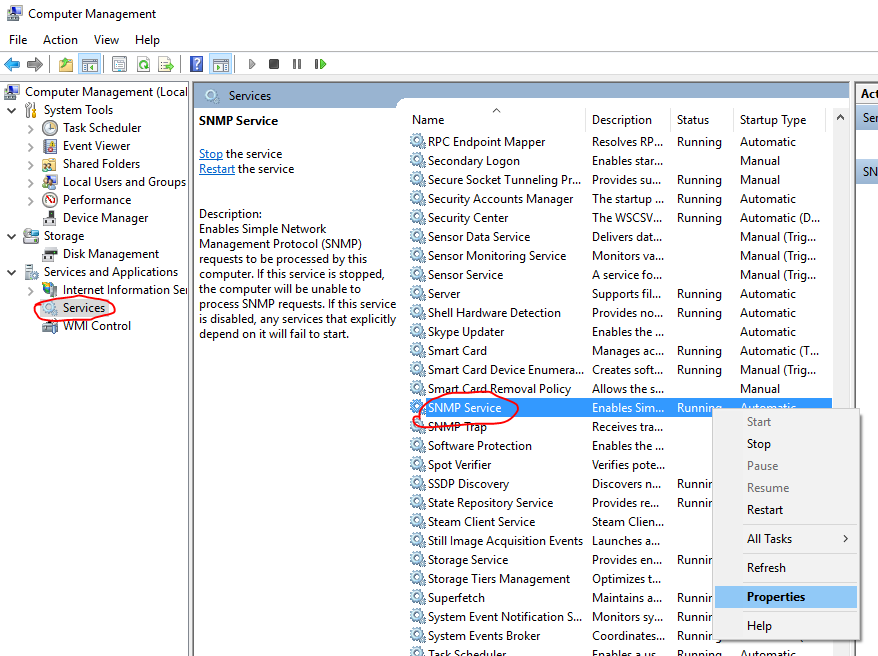
- เปิด Computer Management คลิกขวาที่ SNMP Service เลือก Properties
- ที่ tab Agent ระบุข้อมูล
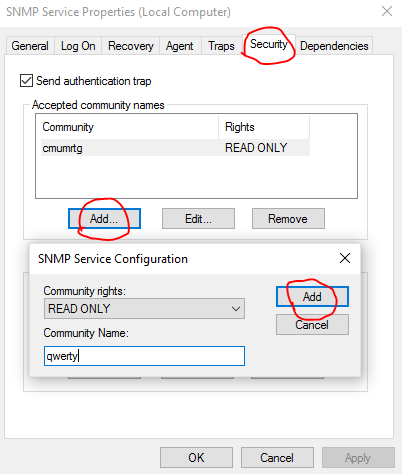
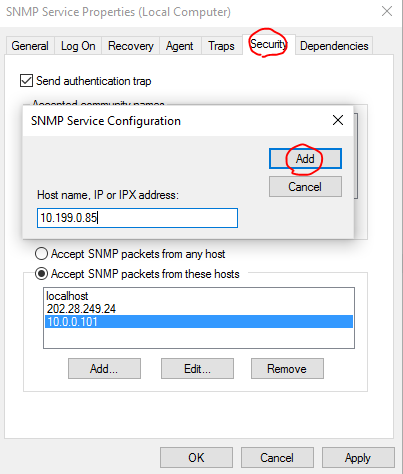
- ที่ tab Security ระบุ Community string และ ip address ของ NMS แล้ว restart Service SNMP
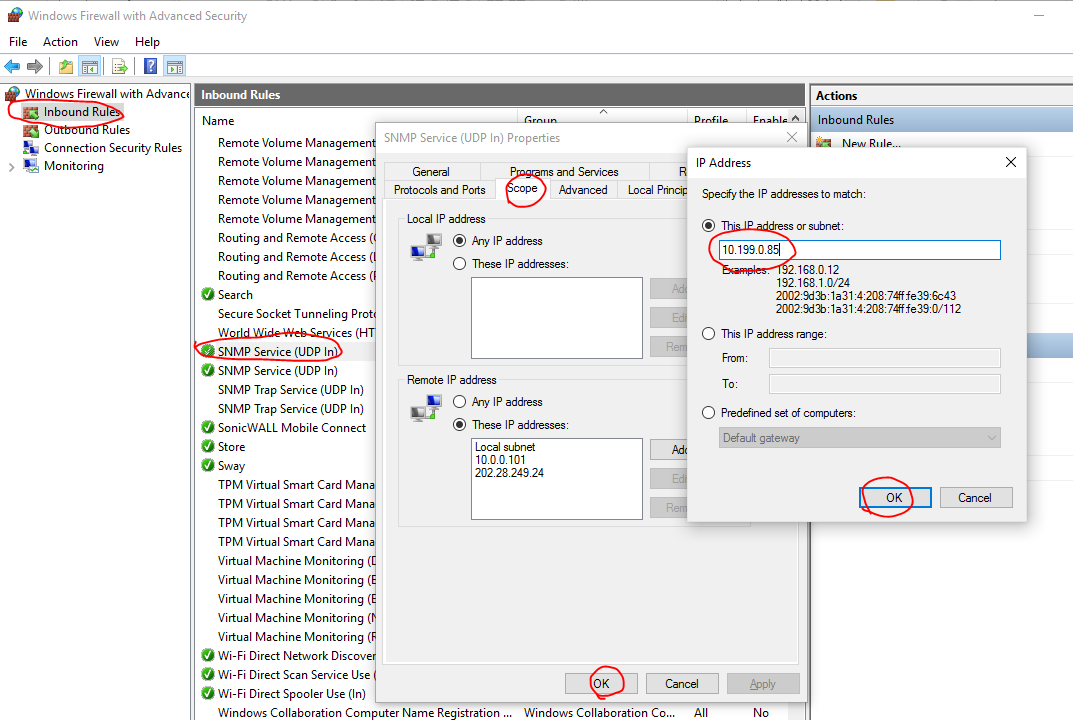
- เปิด Windows Firewall ให้ ip address ของ NMS เข้ามาดึงข้อมูลจาก SNMP service ได้
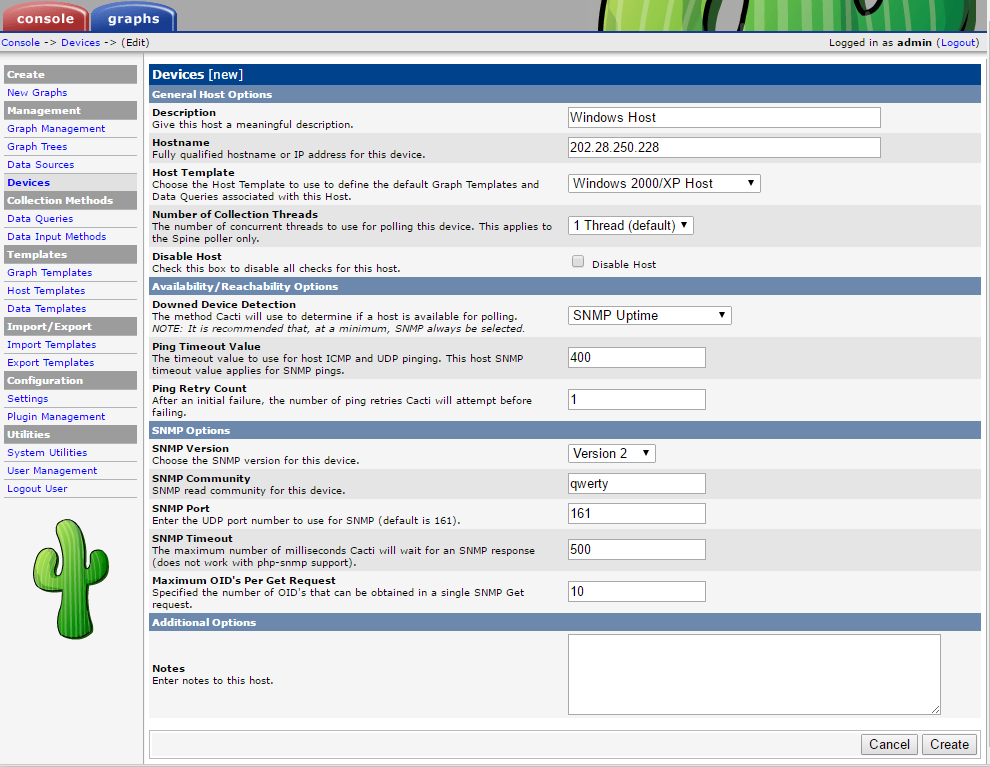
เพิ่มอุปกรณ์
- คลิก Add
- ระบุข้อมูล SNMP ของอุปกรณ์ปลายทาง
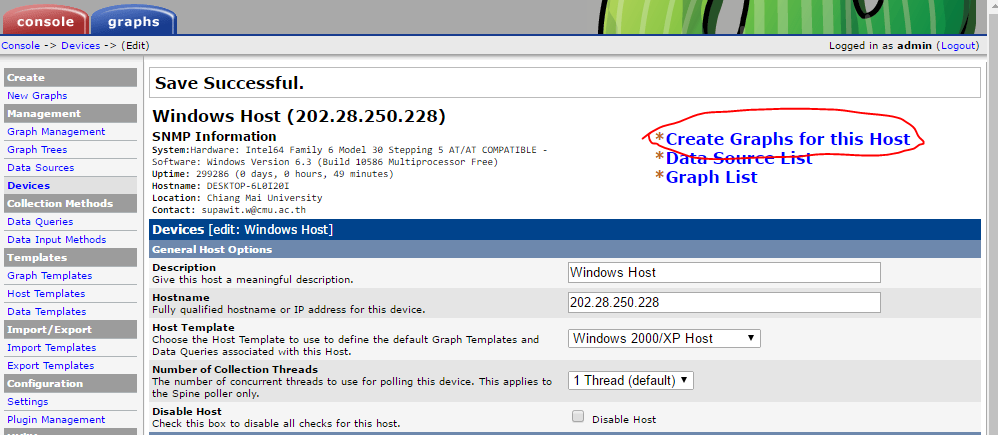
สร้างกราฟ
- คลิก Create Graphs for this host
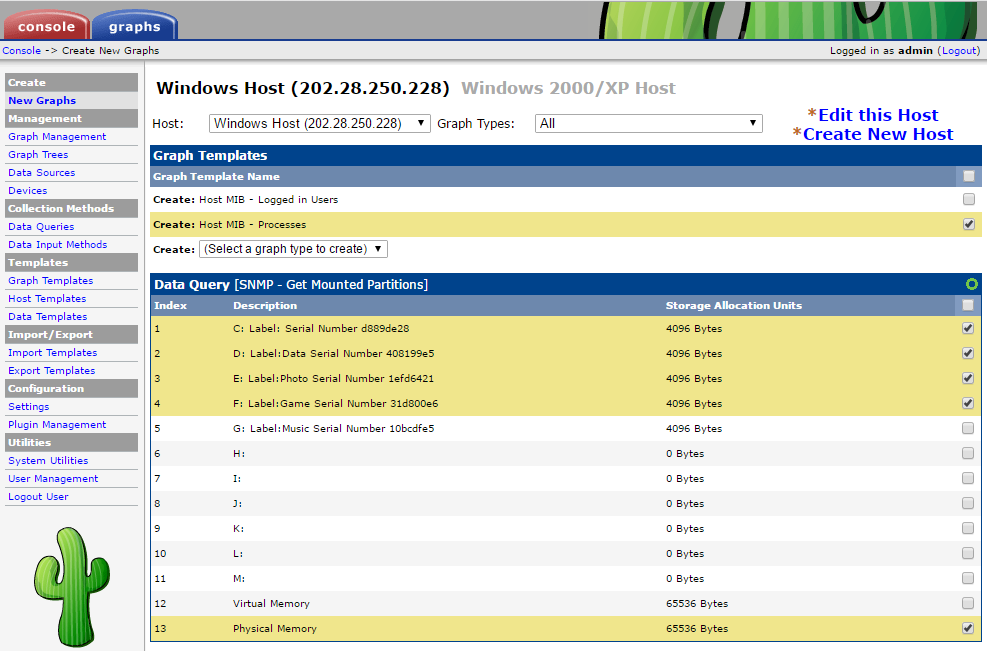
- เลือกสร้างกราฟที่ต้องการ
สร้าง graph tree
- คลิก Graph Trees แล้วคลิก Add
- ระบุรายละเอียด tree แล้วคลิก Create
เพิ่มอุปกรณ์ลงใน tree
- เลือกอุปกรณ์ที่จะเพิ่มลง tree แล้วเลือก Place on a Tree(ชื่อ tree) แล้วคลิก Go
- เลือกที่อยู่ใน tree แล้วคลิก Continue
ดูกราฟ
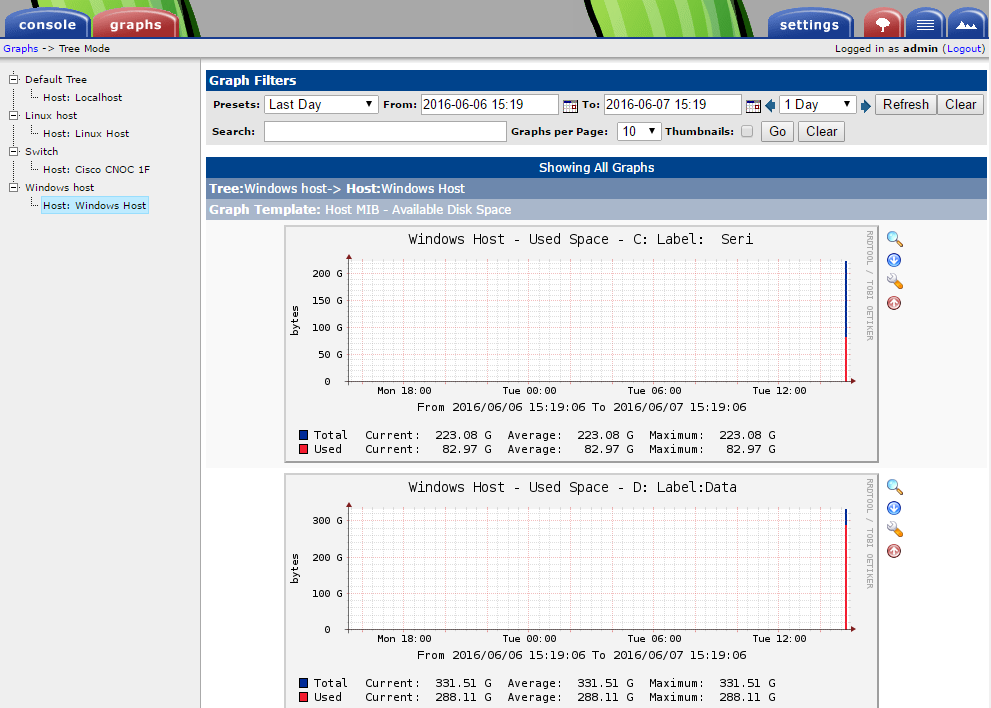
Custom data input and template
เนื่องจาก template ที่ให้มาไม่ครอบคลุม และมีอุปกรณ์เฉพาะที่ต้องการ monitor นอกจาก switch หรือ server เป็นจำนวนผู้ใช้งาน wireless เป็นต้น
สร้าง script สำหรับดึงข้อมูล
script จะเป็นภาษาอะไรก็ได้เช่น php , bash , python โดยใน script ใช้ library ของตนในการดึกข้อมูลจากอะไรก็ได้เช่น SNMP , ssh , REST API(HTTP) เป็นต้น
โดยที่ output จากการ run script บน linux shell จะต้องออกมาในรูปแบบที่ถูกต้องคือ
fieldName1:value1 fieldName2:value2 fieldName3:value3 ...
โดยจะมีข้อมูลกี่ field ก็ได้คั่นด้วยช่องว่าง จำนวน field ของ script output จะมีผลต่อการการสร้าง template ในการเก็บข้อมูลของ cacti
ตัวอย่าง script ดึงข้อมูลจำนวนผู้ใช้งาน wireless จาก cisco controller แยกตาม ssid
<?php
$controller = $argv[1];
$community_string = $argv[2];

$snmp = snmp2_walk($controller,$community_string,'1.3.6.1.4.1.14179.2.1.4.1.7'); // bsnMobileStationSsid
$result = array_count_values($snmp);

$JumboPlus              = isset($result['STRING: @JumboPlus'])?$result['STRING: @JumboPlus']:0;
$TOTWiFi                = isset($result['STRING: @TOT_Wi-Fi'])?$result['STRING: @TOT_Wi-Fi']:0;
$AISWiFi                = isset($result['STRING: @ AISwifi'])?$result['STRING: @ AISwifi']:0;
$TRUEWiFi               = isset($result['STRING: .@  TRUEWIFI'])?$result['STRING: .@  TRUEWIFI']:0;
$eduroam                = isset($result['STRING: eduroam'])?$result['STRING: eduroam']:0;

echo trim("jumboplus:$JumboPlus tot:$TOTWiFi ais:$AISWiFi true:$TRUEWiFi eduroam:$eduroam");
?>
run script บน shell จะได้ output
supawit@cacti:/usr/share/cacti/site/scripts$ php cisco_user_count_per_ssid_poller_tot.php [controller ip address] [community string]
jumboplus:8954 tot:101 ais:1250 true:269 eduroam:22supawit@cacti:/usr/share/cacti/site/scripts$
สร้าง script ดึงข้อมูล CPU Load ของ windows
สร้างไฟล์ /usr/share/cacti/site/scripts/winCpuLoad.php
<?php
$host = $argv[1];
$community = $argv[2];

$result = snmpwalk($host,$community,'hrProcessorLoad');
$result = str_replace('INTEGER: ',"",$result);

$output = "";
foreach($result  as $index => $value)
{
        $output .= "cpu$index:$value ";
}
echo trim($output);
?>
run script บน shell
root@ubuntu:~# cd /usr/share/cacti/site/scripts/
root@ubuntu:/usr/share/cacti/site/scripts# php winCpuLoad.php [ip] [community string]
cpu0:5 cpu1:5 cpu2:7 cpu3:6root@ubuntu:/usr/share/cacti/site/scripts#
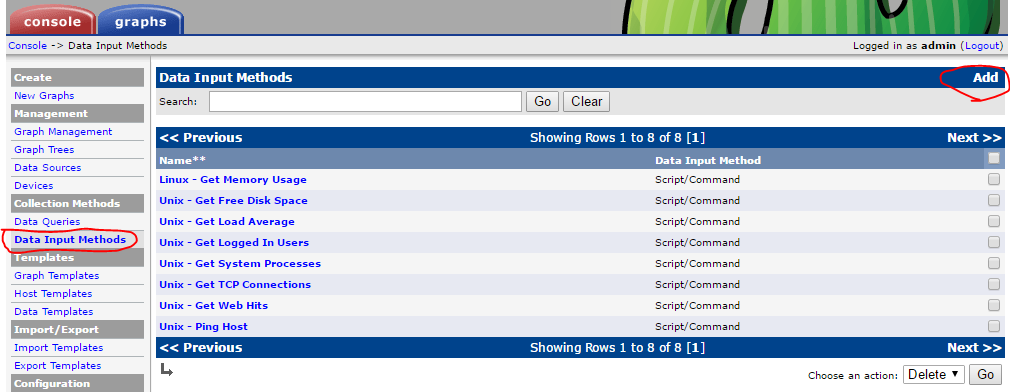
สร้าง Data Input Method
ต้องสร้างให้สอดคล้องกับ script ที่สร้างไว้ในที่นี่คือ cpu 4 core
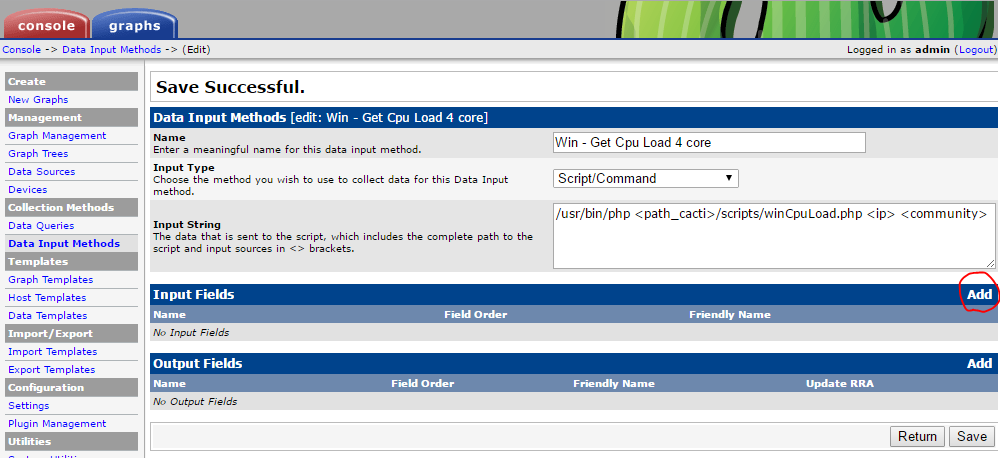
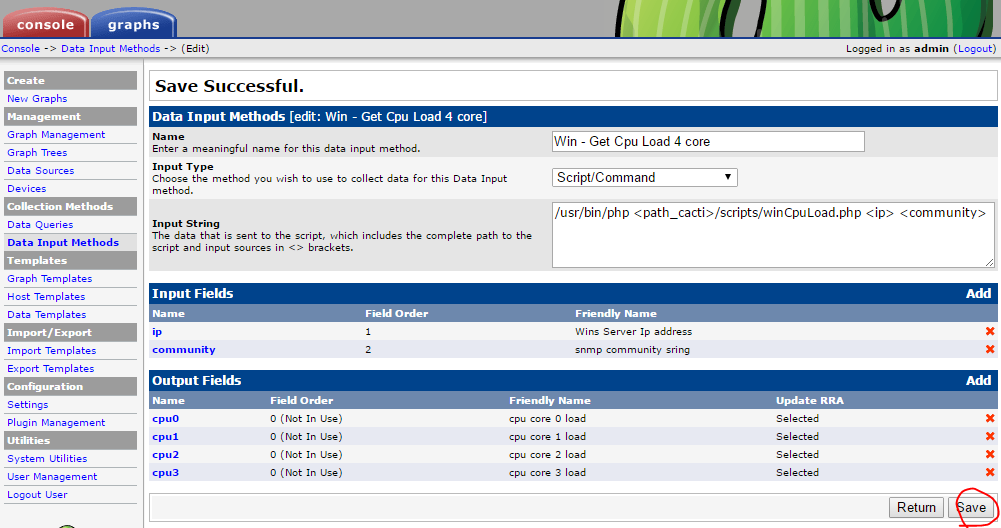
- ที่เมนู Data Input Method คลิก Add
- ระบุรายละเอียดของ Data Input Method โดยค่าที่ที่อยู่ใน <> เป็นตัวแปร
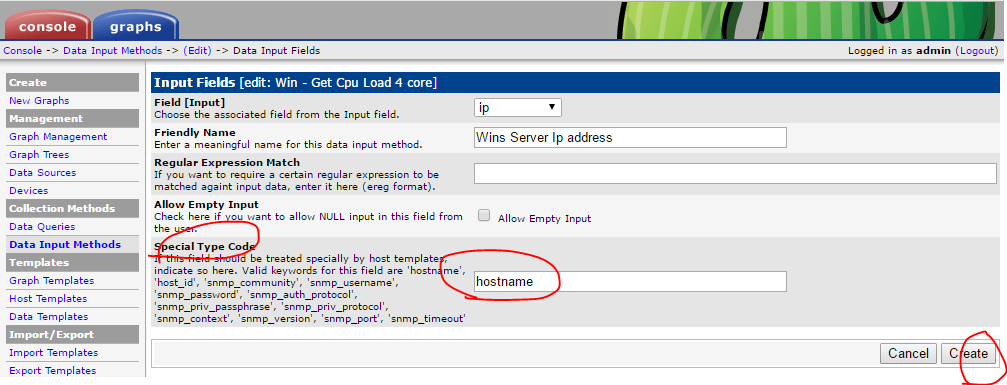
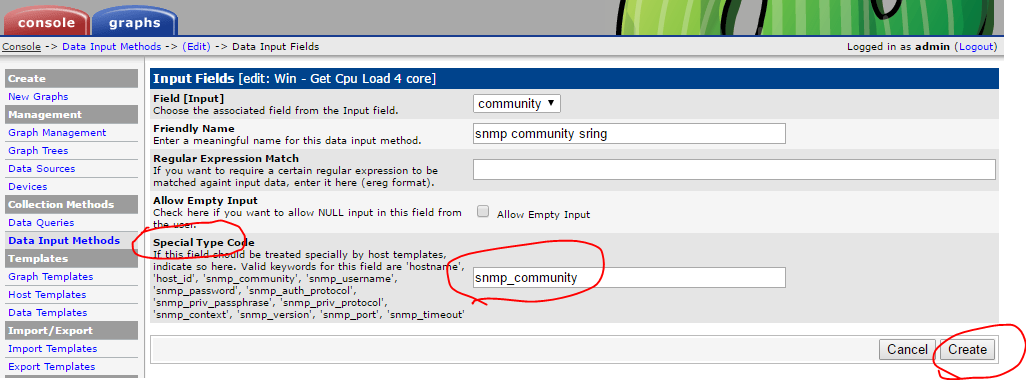
- เพิ่ม Input Field ให้สอดคล้องกับ script
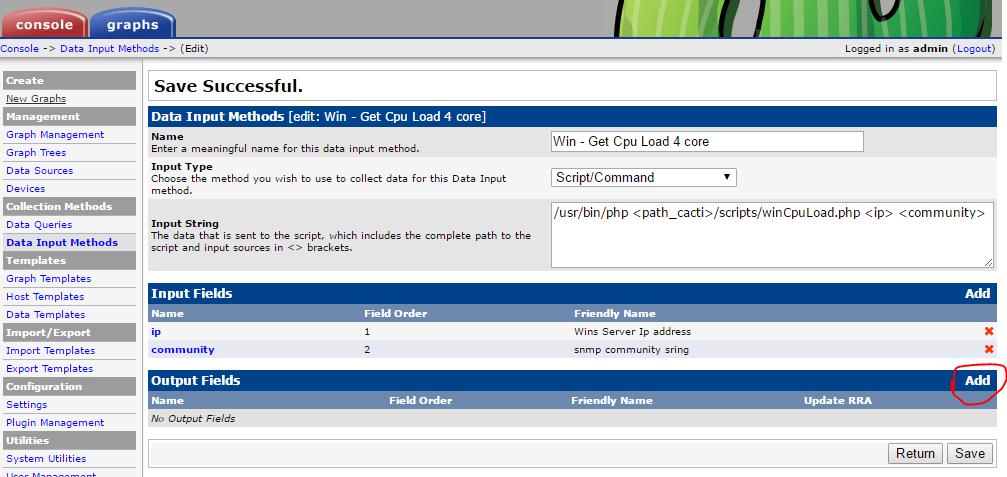
เลือกตัวแปร Input โดยใช้ Special Type Code คือรับจากจาก device ที่ตั้งไว้ - เพิ่ม Output Field ให้สอดคล้องกับ script
โดยชื่อของ Field [Output] จะต้องตรงกับชื่อ field ของ script
ในที่นี้ script output เป็นcpu0:5 cpu1:5 cpu2:7 cpu3:6ให้สร้าง Output Field จนครบ
สร้าง Data Template
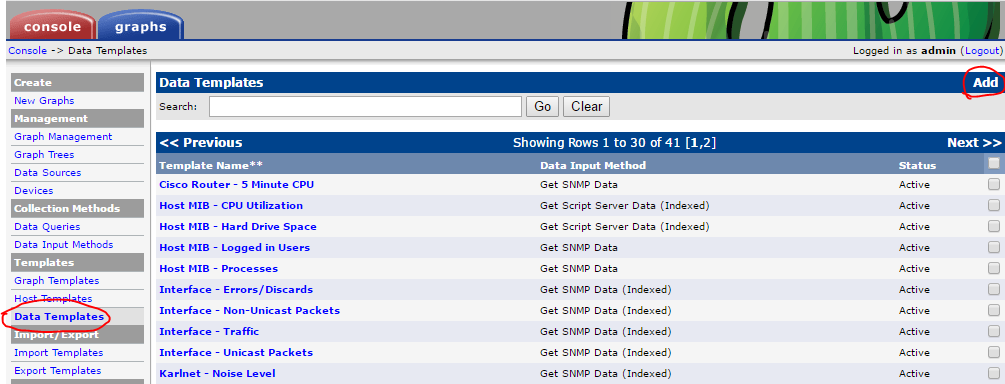
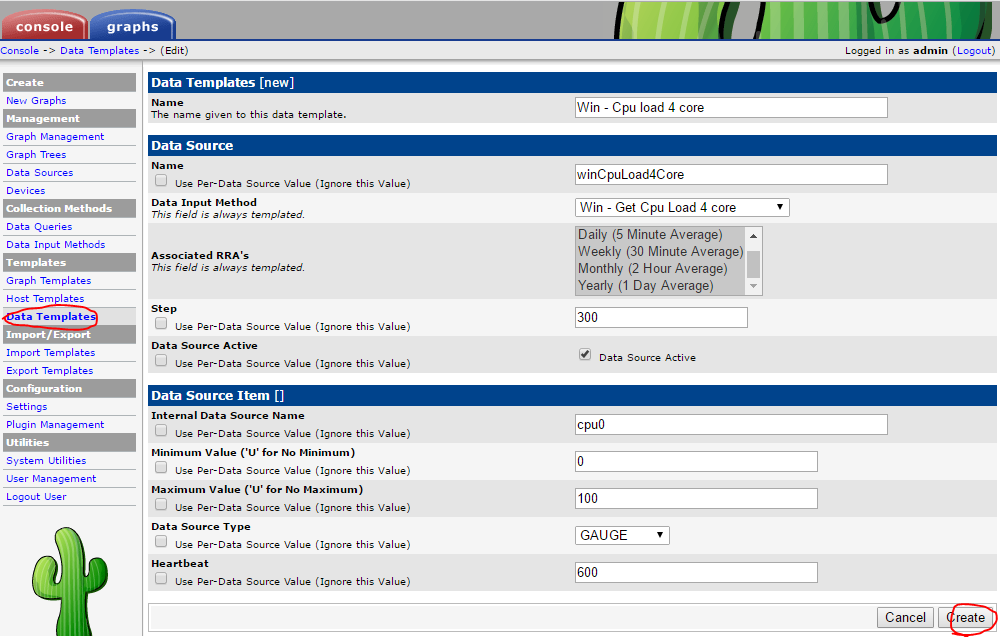
คือการกำหนดคุณลักษณะของไฟล์ rrdtool ที่จะใช้เก็บข้อมูลจาก Data Input Method ซึ่งต้องทำให้สอดคล้องกัน
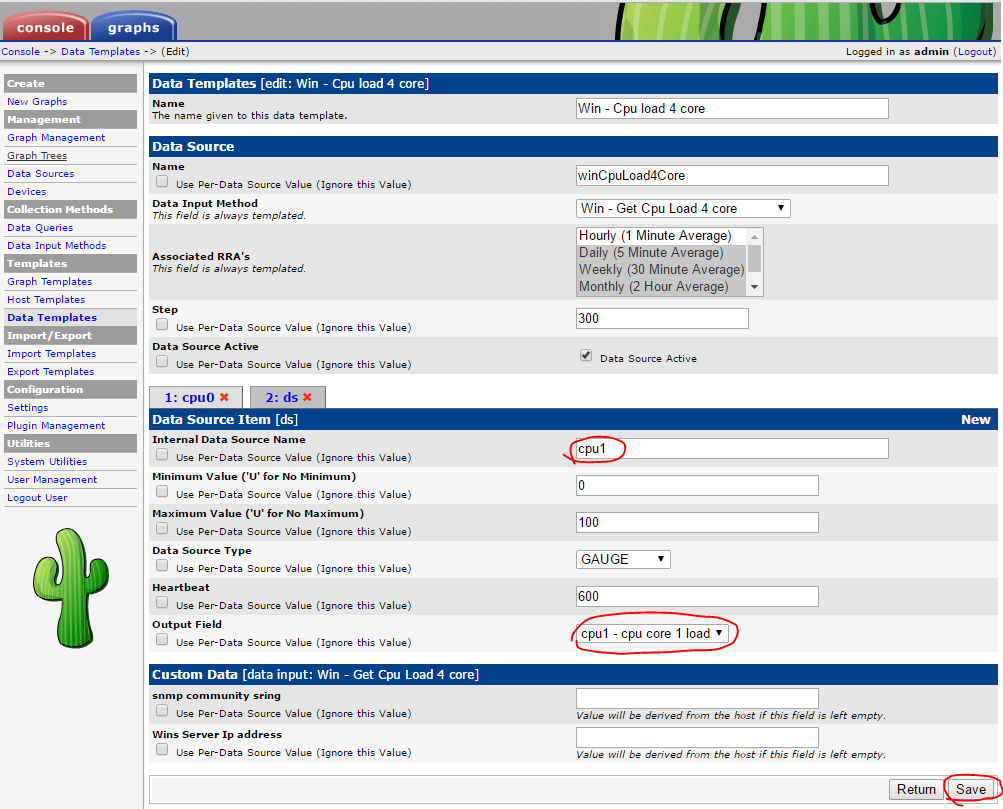
- ที่เมนู Data Templates คลิก Add
- ระบุรายละเอียดของ Data Templates
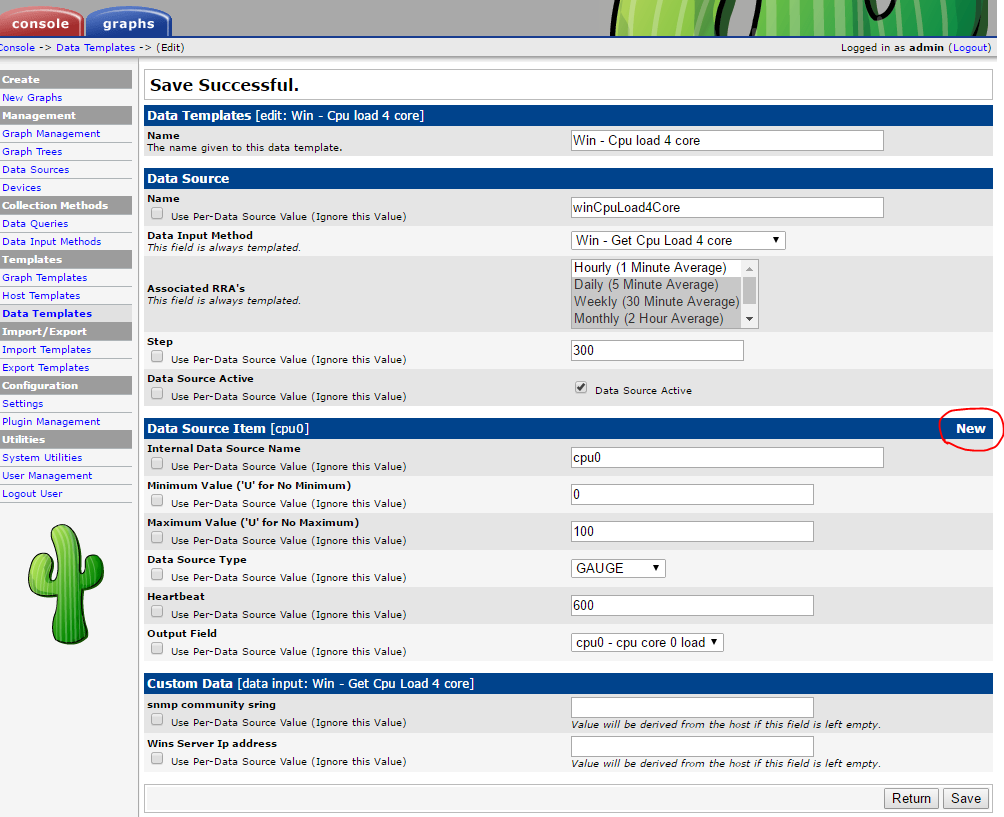
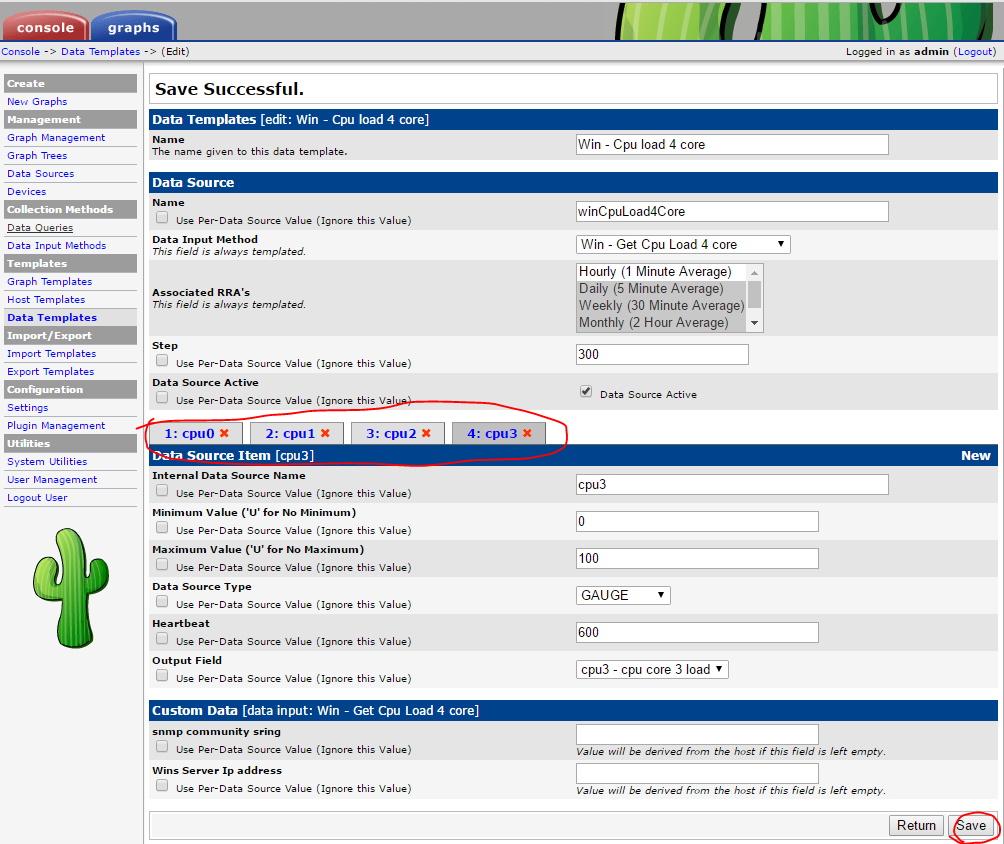
- เพิ่ม Data Source ให้สอดคล้องกับ Output Field ของ script
- เพิ่ม Data Source ให้ครบทุก Output Field ของ Data Input Method
สร้าง Graph Template
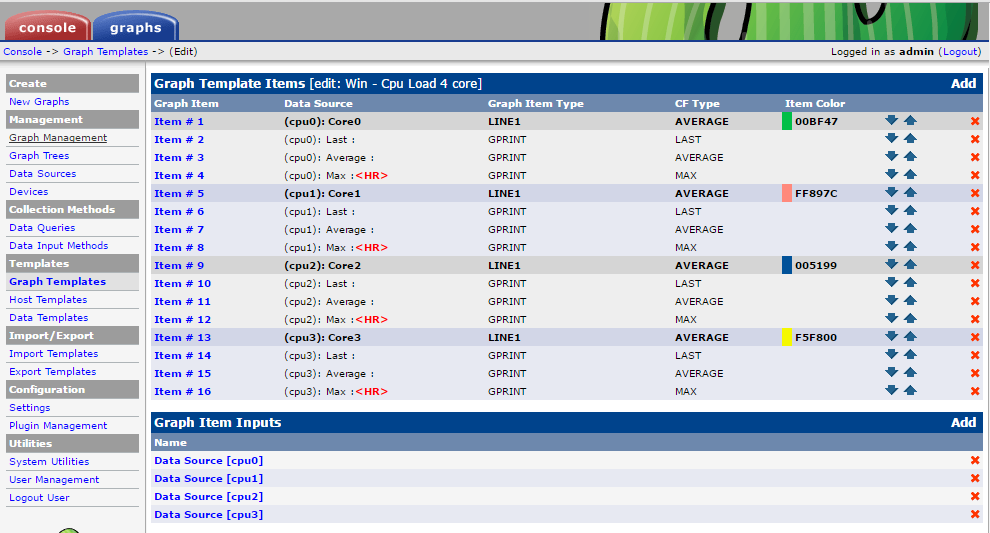
คือการกำหนดคุณลักษณะของกราฟที่จะแสดงเช่นชื่อหัวข้อ สี ลักษณะของกราฟว่าเป็นกราฟเส้นหรือพื้นที่หรือซ้อนต่อกันรวมถึงข้อความต่าง ๆ บนกราฟ
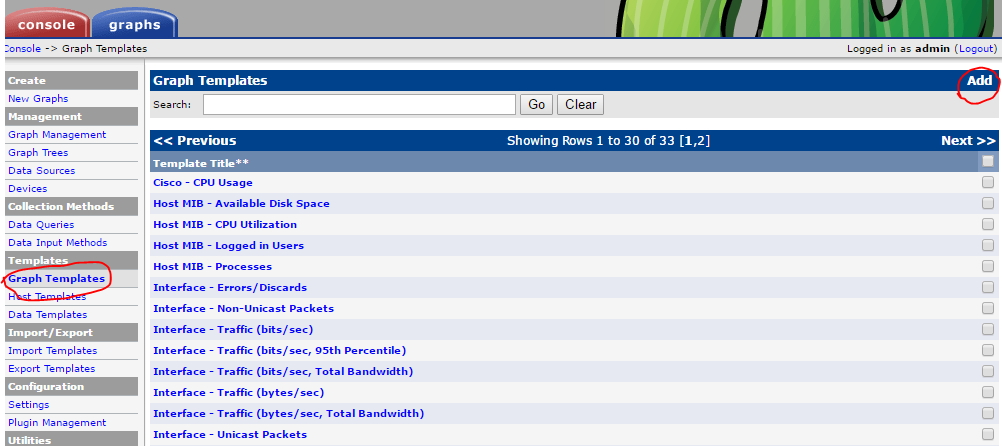
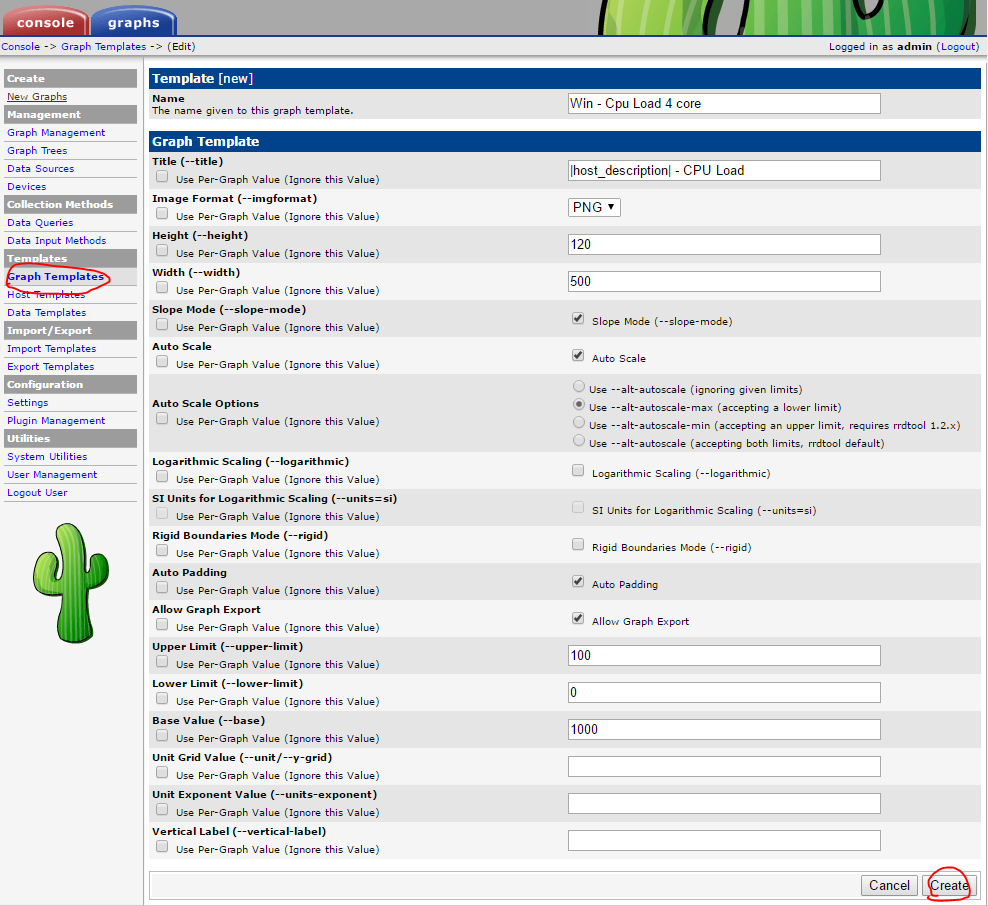
- ที่เมนู Graph Templates กด Add
- ระบุรายละเอียดต่าง ๆ ของกราฟ
- เพิ่มข้อมูลเข้าไปในกราฟ
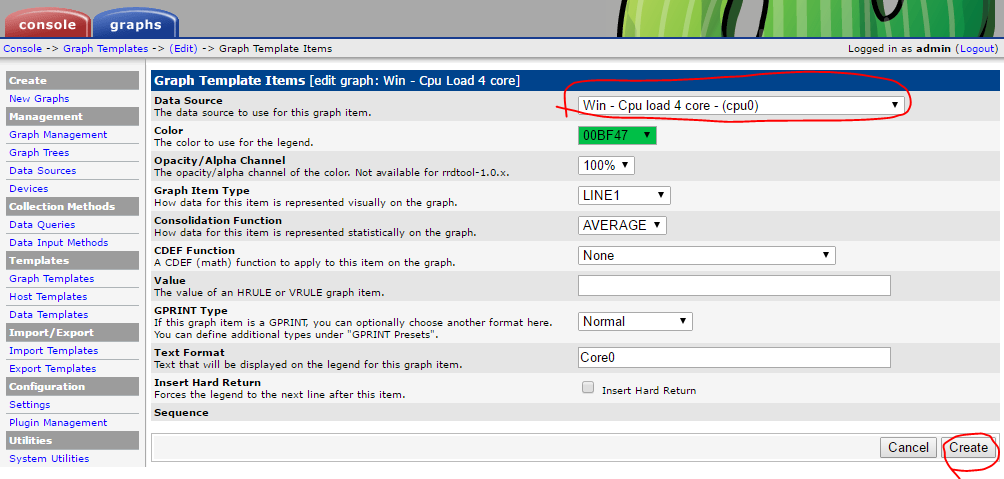
- เลือก Data source และชนิดของกราฟว่าจะเป็นกราฟเส้นกราฟพื้นที่หรือกราฟแบบซ้อน
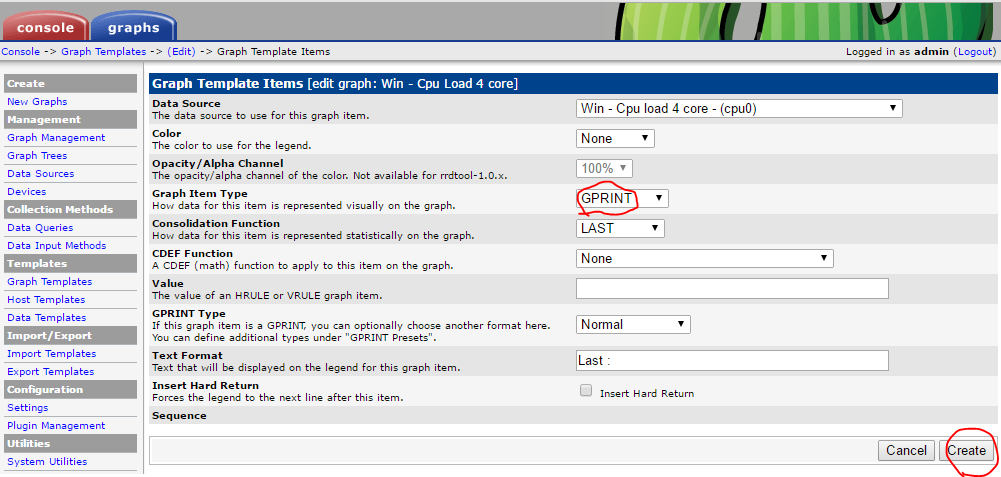
- เพิ่ม Graph Item ชนิด GPRINT เพิ่มแสดงข้อความบนกราฟ โดยแสดงค่าล่าสุด
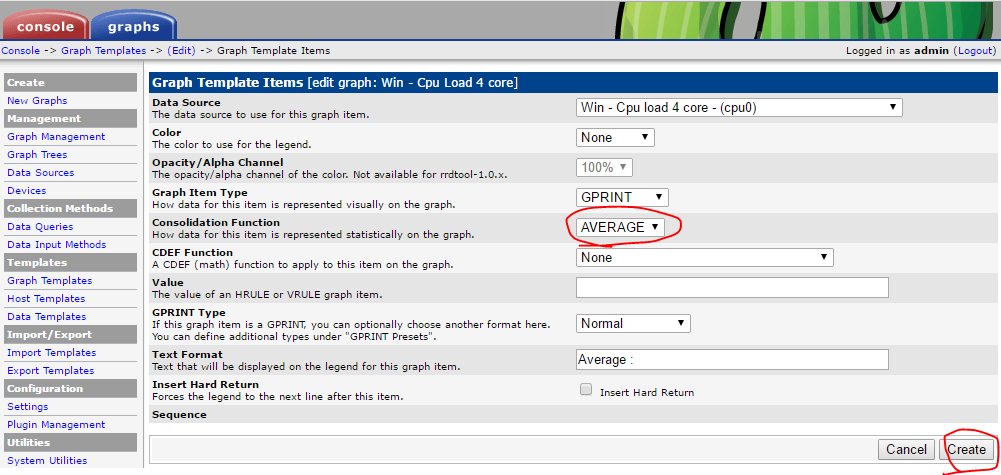
- เพิ่ม Graph Item ชนิด GPRINT เพิ่มแสดงข้อความบนกราฟ โดยแสดงค่าเฉลี่ย
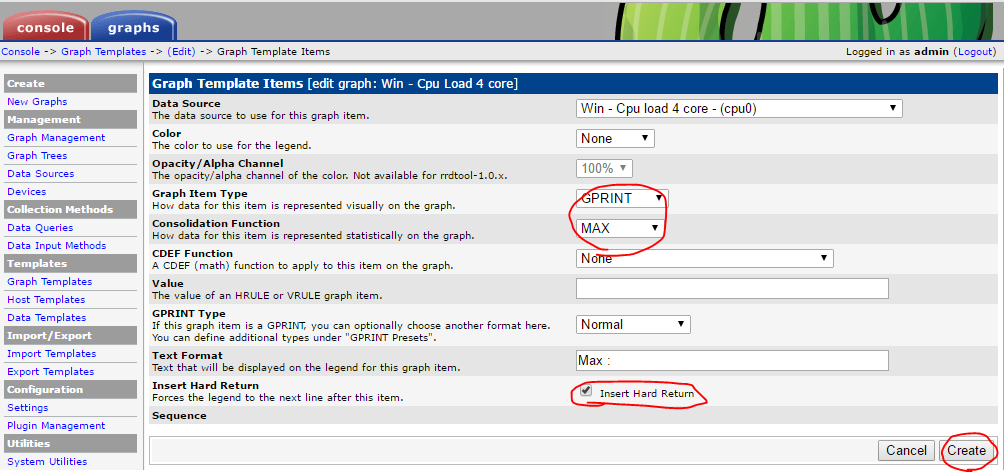
- เพิ่ม Graph Item ชนิด GPRINT เพิ่มแสดงข้อความบนกราฟ โดยแสดงค่าสูงสุด เลือก Insert Hard Return เพื่อขึ้นบรรทัดใหม่
- เลือก Data source และชนิดของกราฟว่าจะเป็นกราฟเส้นกราฟพื้นที่หรือกราฟแบบซ้อน
- เพิ่ม Graph Item อันที่เหลือให้ครบทุก Data Source
สร้างกราฟ
- ที่เมนู Device เลือก Host Windows ที่สร้างไว้ ในส่วน Associated Graph Templates -> Add Graph Template เลือก Win - Cpu Load 4 Core ที่สร้างไว้ แล้ว Add
- คลิกที่ Create Graphs for this Host
- เลือก Graph Template Win - Cpu Load 4 core ที่สร้างไว้ แลเว Create
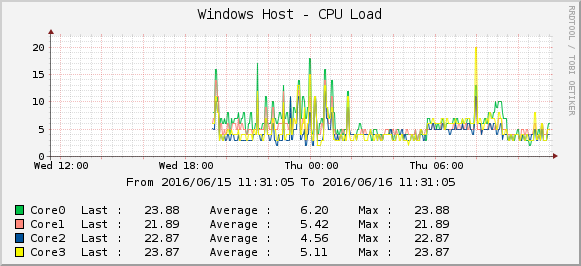
- ที่ Graph ของ Device จะเห็นกราฟเพิ่มขึ้นมา
การแก้ไขปัญหา
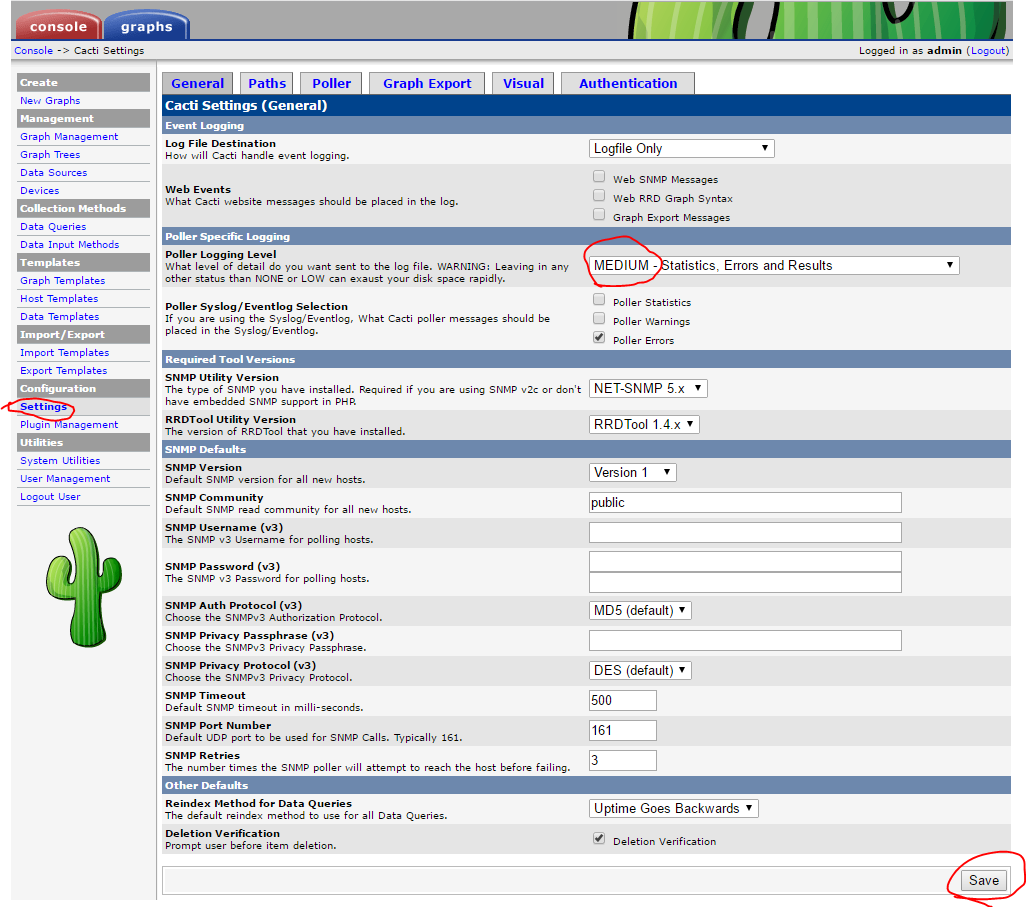
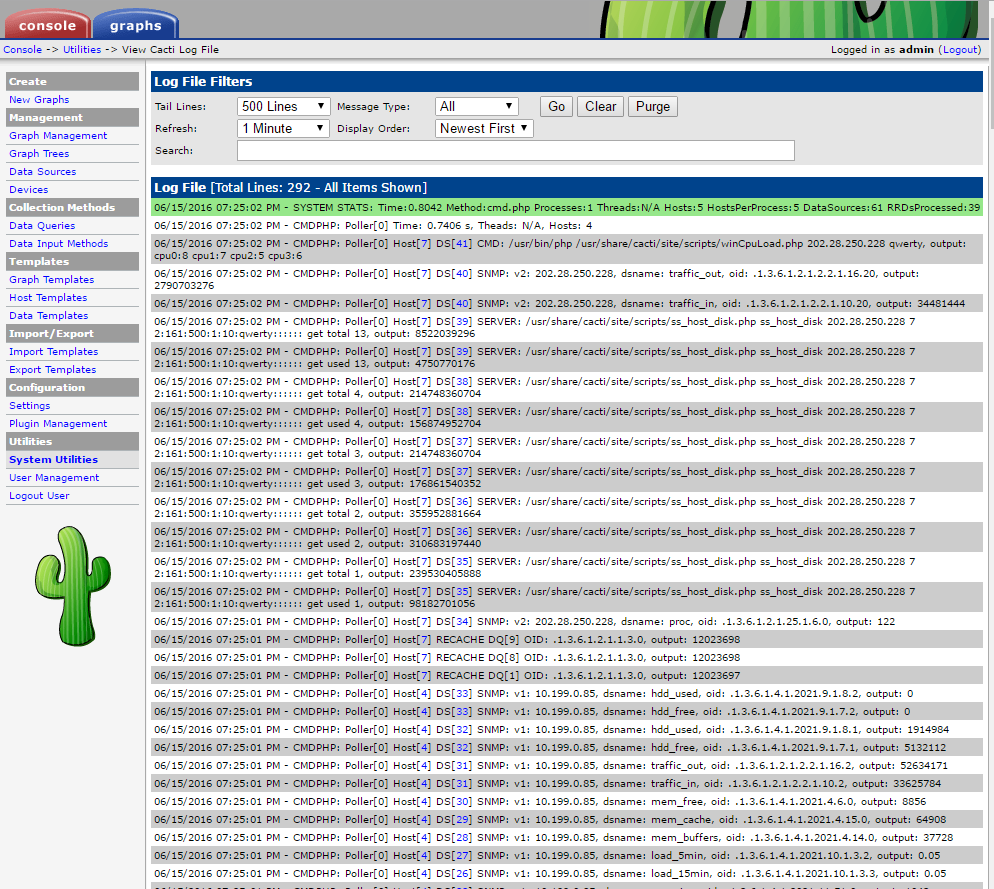
- ไปที่เมนู Settings ที่ tab General ในส่วนของ Poller Logging Level เลือกเป็น MEDIUM
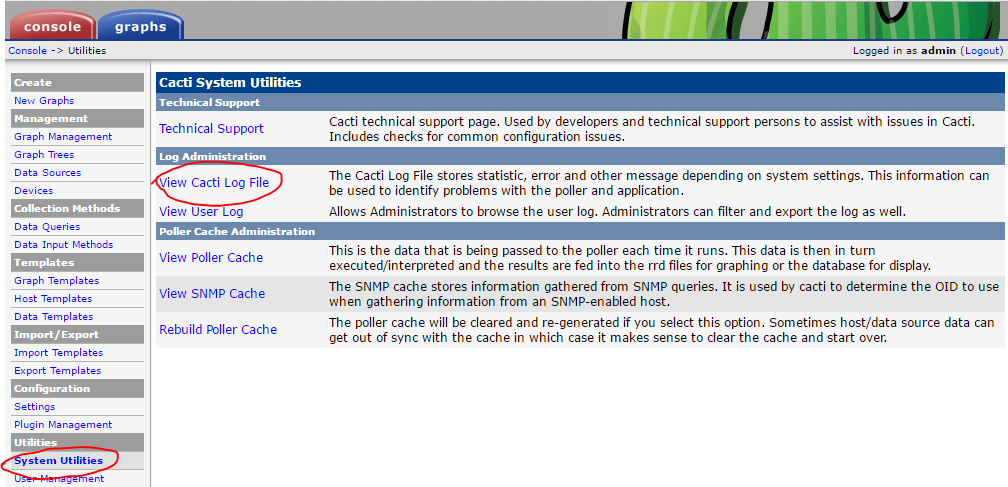
- ไปที่เมนู System Utilities เลือก View Cacti Log File จะมีรายละเอียดอยู่
- การปรับ Logging Level เป็น MEDUIM หรือสูงกว่าควรปรับเฉพาะต้องการแก้ไขปัญหา หลังจากแก้ไขเสร็จควรปรับเป็น LOW เนื้่องจากถ้ามีอุปกรณ์จำนวนมาก Log File จะใหญ่เกินไป
การ Import Template : ยกตัวอย่าง ApacheStats
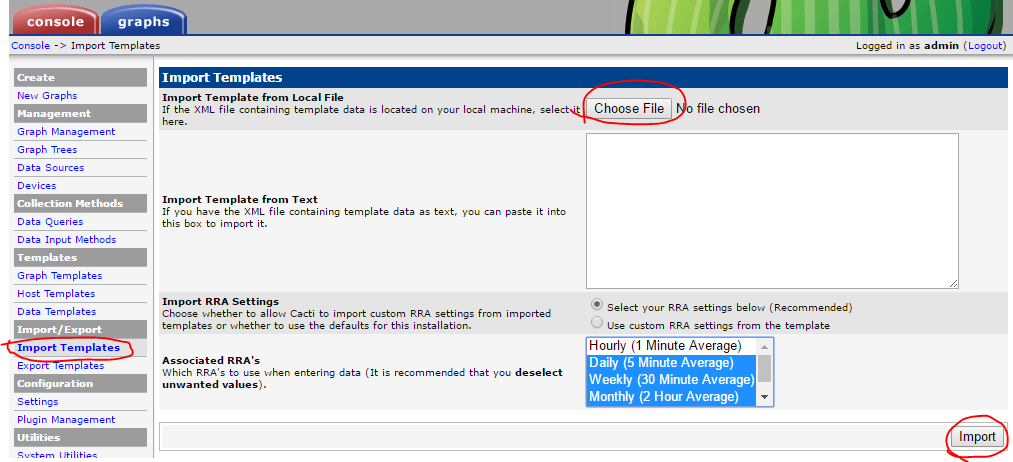
Cacti สามารถใช้งาน template ที่สร้างไว้แล้วได้ โดย import template เข้ามาไม่ว่าจะเป็น Data Input Method, Data Template, Graph Template, Host Template และ script ต่าง ๆ ยกตัวอย่างการใช้งาน ApacheStats Template
ปรับแต่ง apache เพื่อให้เข้าถึงค่าสถิติได้
- แก้ไขไฟล์ /etc/apache2/mods-enabled/status.conf
        <Location /server-status>
                SetHandler server-status
                Require local
                Require ip [cacti host ip]
        </Location>
- restart apache
service apache2 restart
- ทดสอบเรียกดู apache statistics ผ่าน url http://[host ip]/server-status หรือ http://[host ip]/server-status?auto
root@ubuntu:~# curl  http://10.199.0.85/server-status?auto
Total Accesses: 95
Total kBytes: 670
CPULoad: .121508
Uptime: 716
ReqPerSec: .132682
BytesPerSec: 958.212
BytesPerReq: 7221.89
BusyWorkers: 1
IdleWorkers: 9
Scoreboard: _______.._W_..........................................................................................................................................
ดาวน์โหลดและติดตั้ง ApacheStats
- ไปที่ http://forums.cacti.net/viewtopic.php?t=25227 แล้ว Download File ApacheStats_0.8.2.zip มาที่ /tmp จากนั้น copy file ไปยังห้องที่เก็บ scripts ของ cacti
cd /tmp
curl -O http://myweb.cmu.ac.th/supawit.w/cacti/uninet/ApacheStats_0.8.2.zip
unzip ApacheStats_0.8.2.zip
cp ApacheStats_0.8.2/ss_apache_stats.php /usr/share/cacti/site/scripts/
- ทดสอบ script
php /usr/share/cacti/site/scripts/ss_apache_stats.php 10.199.0.85
apache_total_hits:241 apache_total_kbytes:1949 apache_cpuload:.115689 apache_busy_workers:1 apache_idle_workers:9 thread_W:9 threadS:0 threadR:0 threadW:1 threadK:0 threadD:0 threadC:0 threadL:0 threadG:0 threadI:0 thread_O:140
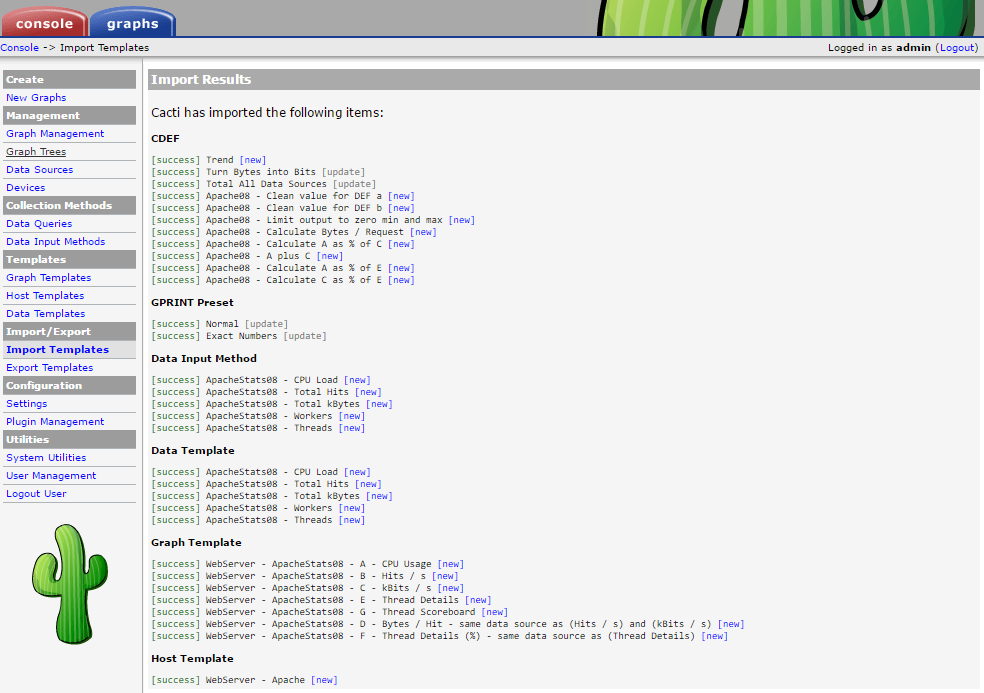
- Import Template ไปที่เมนู Import Template แล้ว Choose File โดยเลือกไฟล์ cacti_host_template_webserver_-_apache.xml ที่อยู่ใน ApacheStats_0.8.2.zip
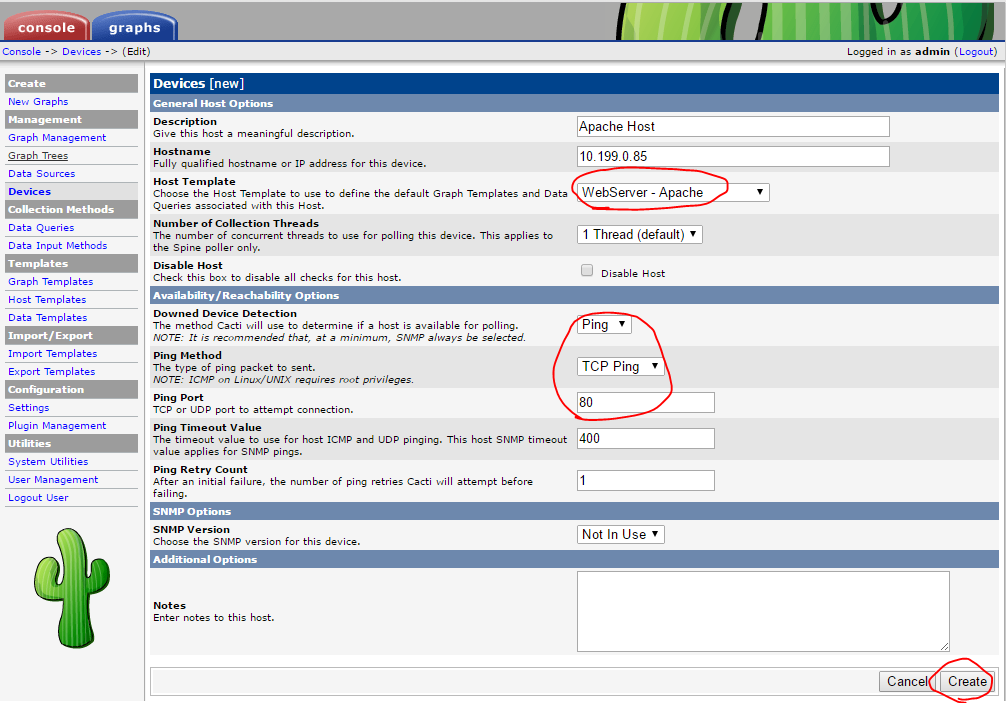
- เพิ่ม Device ใหม่โดยใช้ Host Template เป็น WebServer - Apache
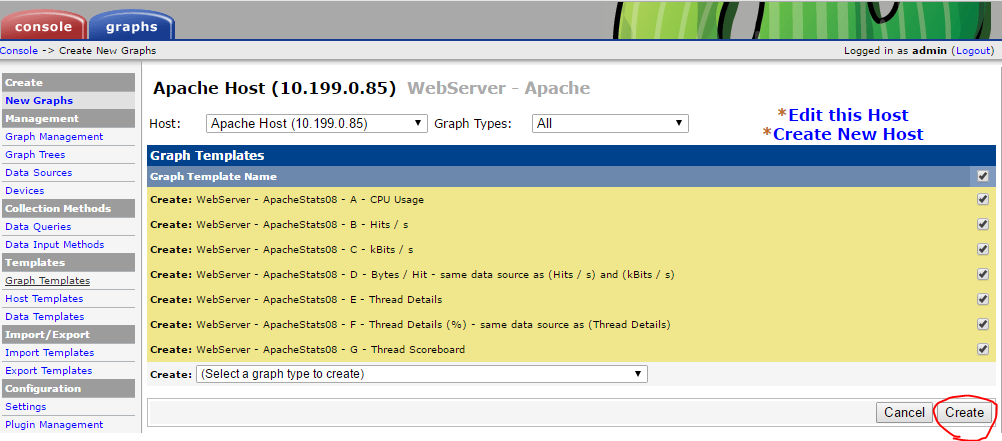
- สร้างกราฟที่ต้องการ
- เพิ่ม Device ลงใน tree

- ดูกราฟ
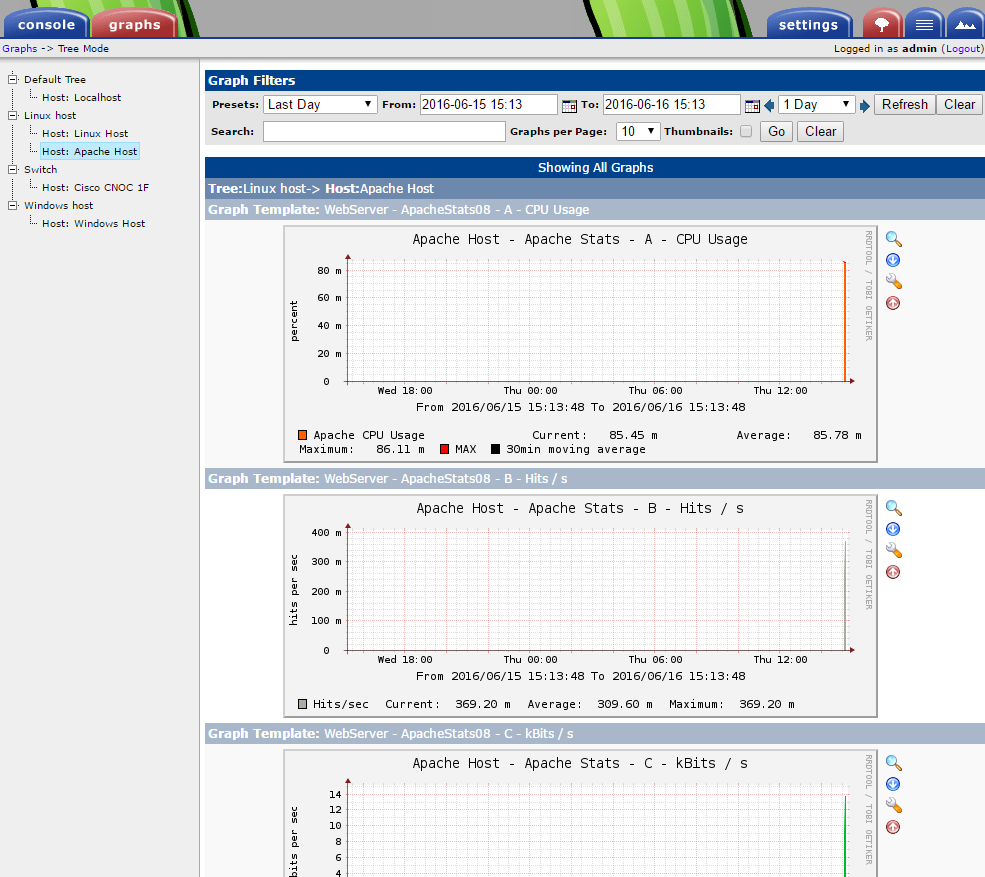
สร้าง folder layout สำหรับติดตั้ง plugins
mkdir -p /usr/local/share/cacti/plugins
mv /usr/share/cacti/site/plugins/* /usr/local/share/cacti/plugins/
rmdir /usr/share/cacti/site/plugins
ln -s /usr/local/share/cacti/plugins /usr/share/cacti/site/plugins
ln -s /usr/share/cacti/site/include /usr/local/share/cacti/include
ln -s /usr/share/cacti/site/lib /usr/local/share/cacti/lib
ปรับแต่ง postfix mail server สำหรับส่งอีเมล
ติดตั้ง postfix
apt-get install postfix
ใช้ gmail หรือ hotmail เป็น relay host
โดยปกติหน่วยงานที่มีระบบอีเมลเป็นของตัวเองก็สามารถใช้อีเมลภายในหน่สยงานได้ กรณีต้องการใช้ MTA ภายนอกเช่น gmail หรือ hotmail ก็สามารถทำได้ซึ่งจะสามารถส่งได้จำกัดจำนวนฉบับต่อวัน smtp server ที่ใช้งานได้คือ ซึ่งใช้งานเป็น smtp บน tls
- smtp.gmail.com:587
- smtp.live.com:587
สร้างไฟล์รหัสผ่านทำหรับ log in เข้าใช้ smtp
- สร้างไฟล์ /etc/postfix/sasl_passwd
[smtp host] [email address]:[password]
เช่น
smtp.gmail.com user@gmail.com:passwd
- สร้าง hash ของรหัสผ่านแล้วลบรหัสผ่านแบบ plain text
postmap /etc/postfix/sasl_passwd
rm /etc/postfix/sasl_passwd
chmod 400 /etc/postfix/sasl_passwd.db
- แก้ไขไฟล์ /etc/postfix/main.cf
เพิ่มบรรทัด
smtp_sasl_auth_enable = yes
smtp_sasl_password_maps = hash:/etc/postfix/sasl_passwd
smtp_sasl_security_options = noanonymous
smtp_sasl_tls_security_options = noanonymous
smtp_use_tls = yes
แก้บรรทัด
relayhost = [smtp host]:587
restart postfix
service postfix restart
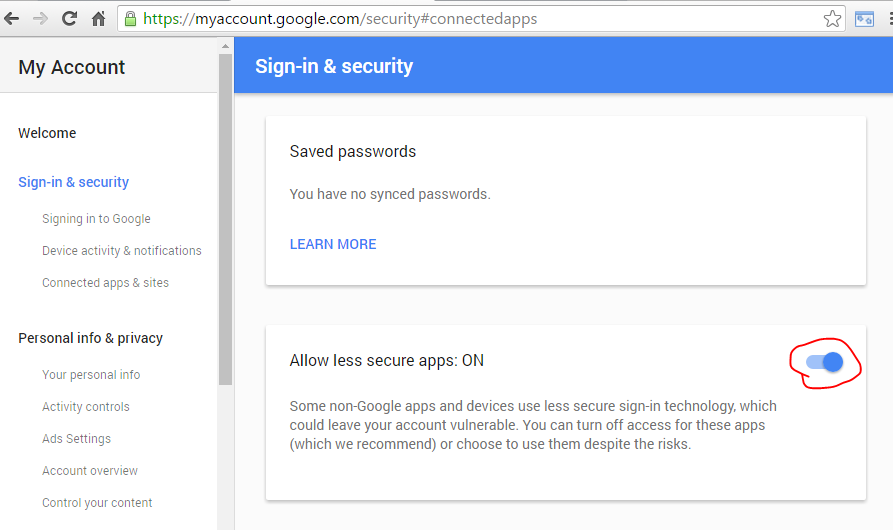
- กรณีใช้ gmail เป็น smtp ต้องไปที่หน้า https://myaccount.google.com/security#connectedapps เพื่อเปิดใช้งาน less secure app
cacti plugin : settings
เป็น plugin พื้นฐานในการตั้งค่าต่าง ๆ เพิ่มเติมเช่นส่งอีเมล Download plugin http://docs.cacti.net/plugin:settings
ติดตั้ง
cd /tmp
curl -O http://myweb.cmu.ac.th/supawit.w/cacti/uninet/settings-v0.71-1.tgz
tar zxvf settings-v0.71-1.tgz
mv settings /usr/local/share/cacti/plugins/
เปิดใช้งาน
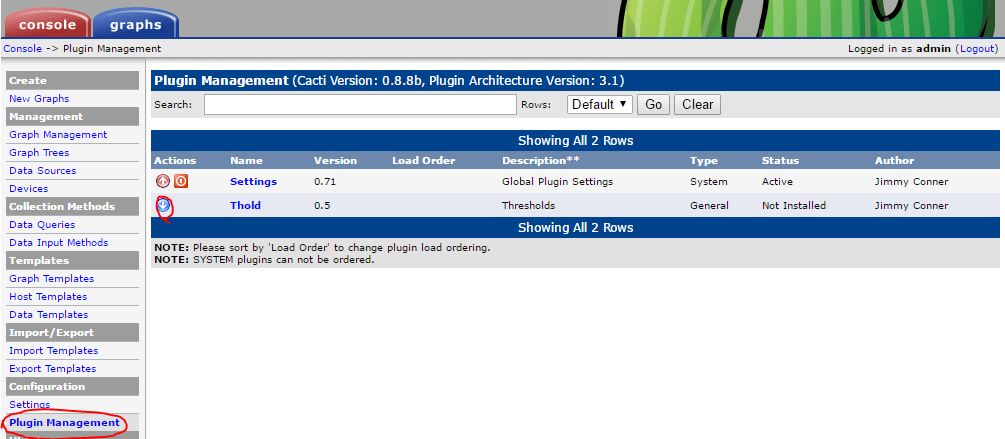
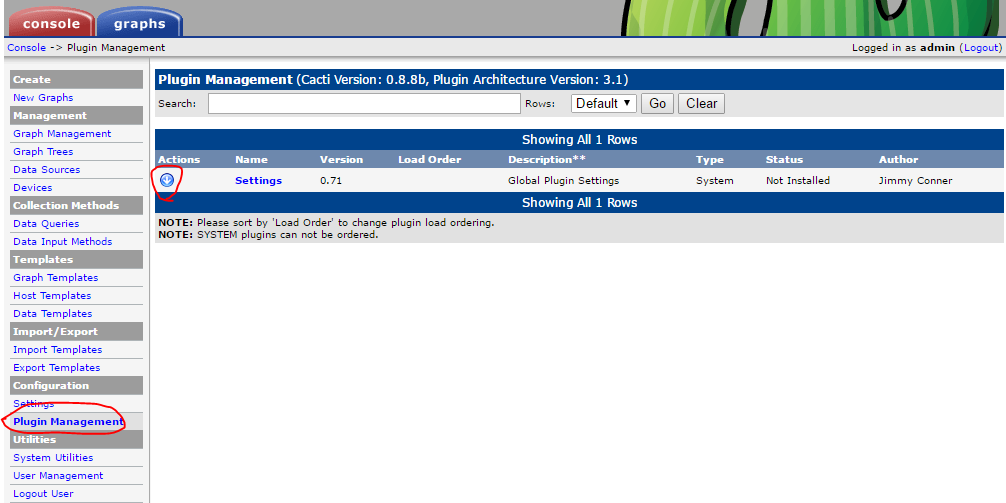
- ที่เมนู Plugin Management จะเห็น plugin ที่ติดตั้ง ให้คลิก Install และ Enable Plugin

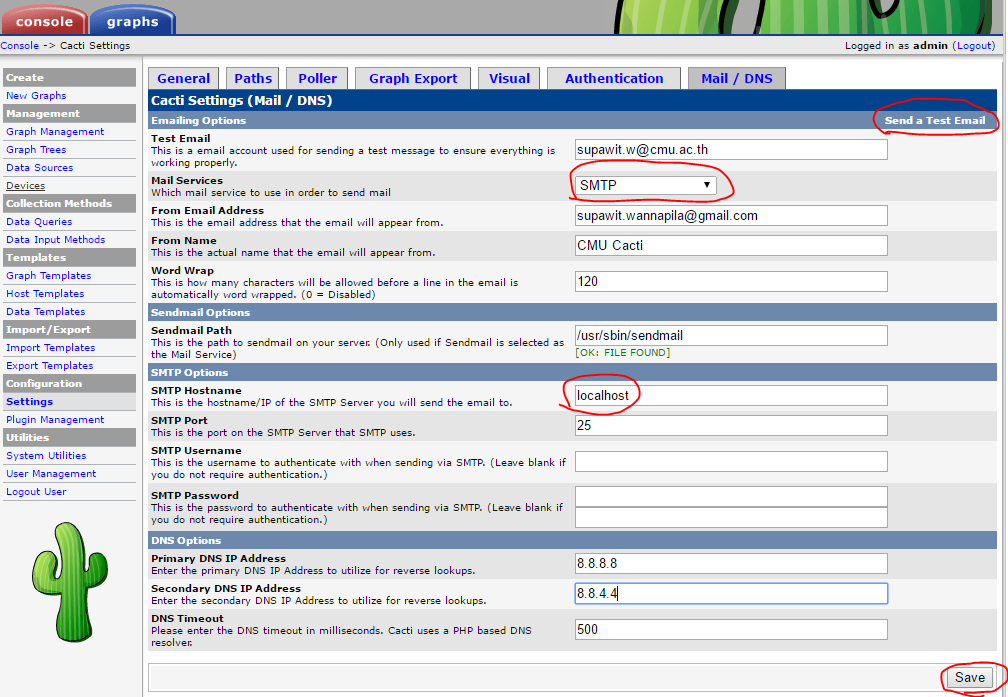
ตั้งค่าอีเมล
- ที่เมนู Settings แท็บ Mail / DNS ให้ระบุค่าเกี่ยวกับ Email server และ DNS server จากนั้นกด Save และทดสอบส่งอีเมลโดยคลิกที่ Send a Test Email
cacti plugin : thold
เป็น plugin สำหรับแจ้งเตือนเห็นการต่าง ๆ ดาวน์โหลดไฟล์ plugin ได้ที่ http://docs.cacti.net/plugin:thold
ติดตั้ง
cd /tmp
curl -O http://myweb.cmu.ac.th/supawit.w/cacti/uninet/thold-v0.5.0.tgz
tar zxvf thold-v0.5.0.tgz
mv thold /usr/local/share/cacti/plugins/
เปิดใช้งาน
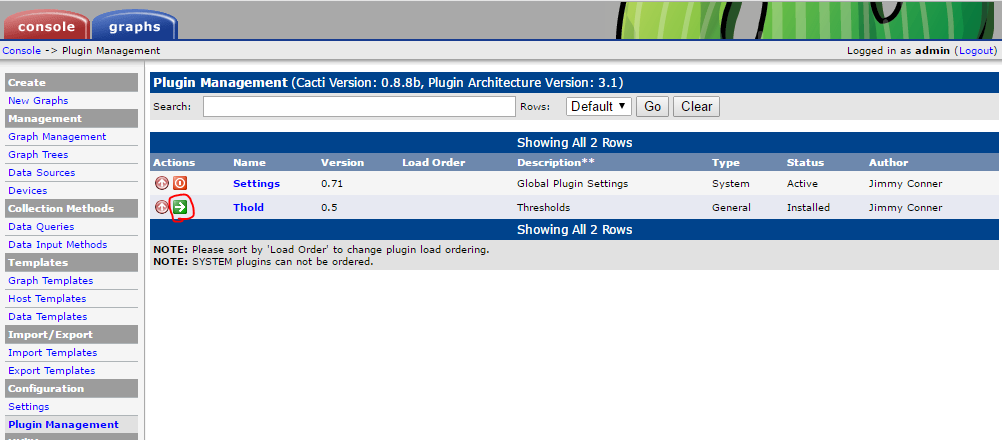
- ที่เมนู Plugin Management จะเห็น plugin ที่ติดตั้ง ให้คลิก Install และ Enable Plugin
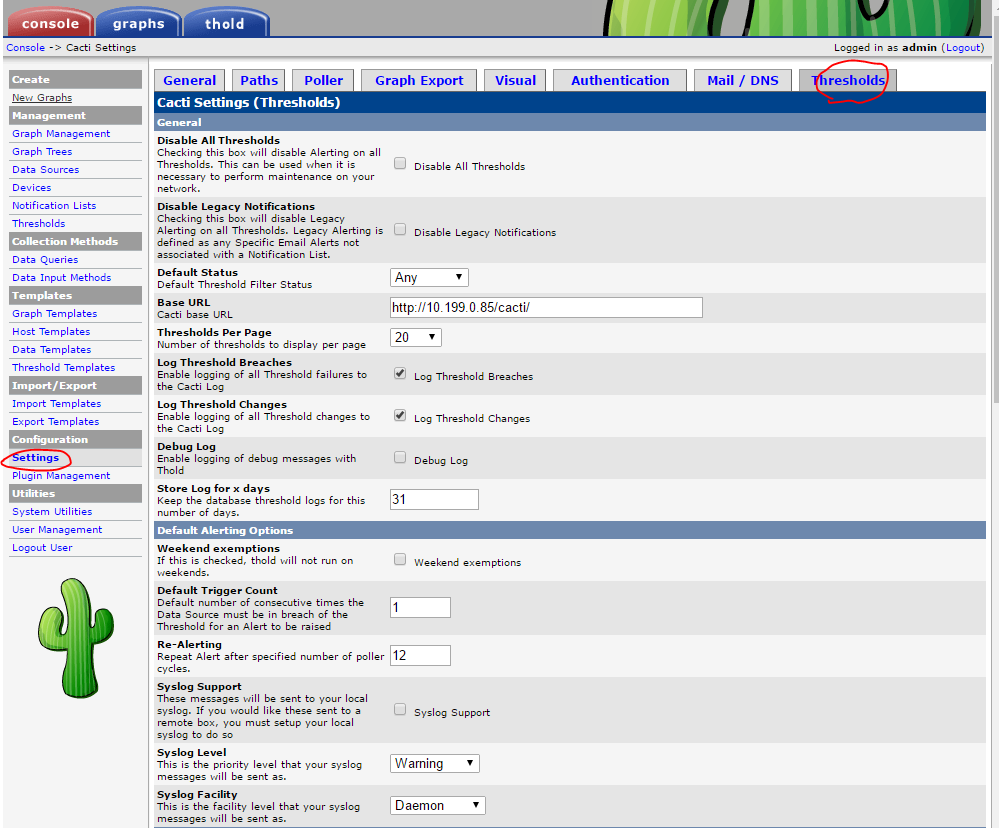
ตั้งค่า thold
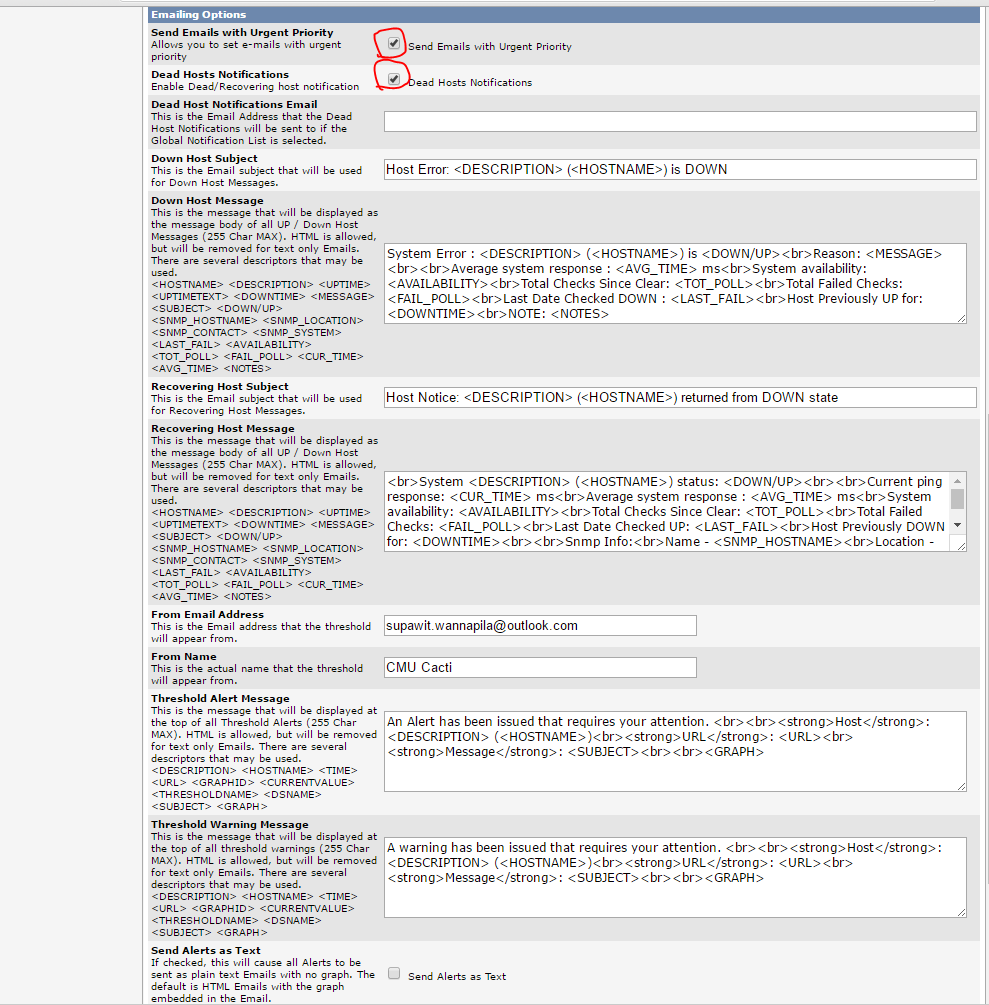
- ที่เมนู Settings แท็บ Thresholds
สร้าง notification list
- ที่เมนู Notification Lists คลิก Add

สร้าง Threshold
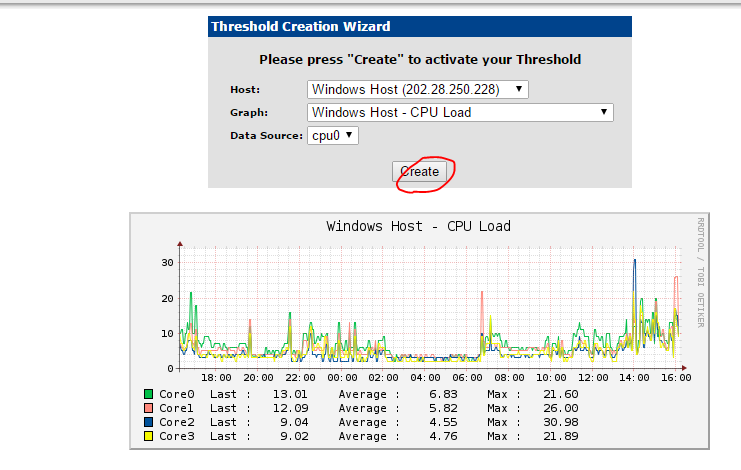
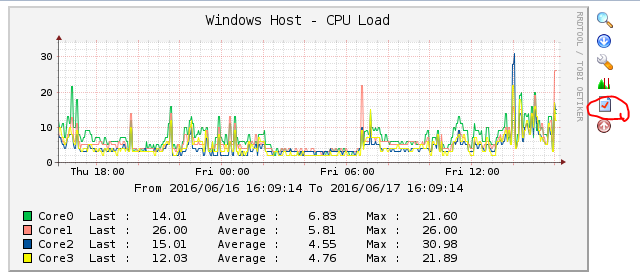
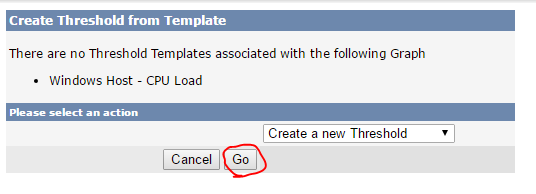
ที่เมนูของกราฟคลิกสร้าง Threshold เลือก Data source ที่จะทำการแจ้งเตือน
