Difference between revisions of "Network monitoring"
| (53 intermediate revisions by the same user not shown) | |||
| Line 28: | Line 28: | ||
service snmpd restart | service snmpd restart | ||
</syntaxhighlight> | </syntaxhighlight> | ||
| + | |||
| + | * แก้ไขไฟล์ '''/etc/snmp/snmp.conf''' เพื่อเปิดใช้งาน mibs ทั้งหมด โดยการ comment บรรทัด | ||
| + | <source lang="bash"> | ||
| + | #mibs: | ||
| + | </source> | ||
== การดึงข้อมูลจาก SNMP == | == การดึงข้อมูลจาก SNMP == | ||
| Line 207: | Line 212: | ||
=== สร้าง script ดึงข้อมูล CPU Load ของ windows === | === สร้าง script ดึงข้อมูล CPU Load ของ windows === | ||
สร้างไฟล์ '''/usr/share/cacti/site/scripts/winCpuLoad.php''' | สร้างไฟล์ '''/usr/share/cacti/site/scripts/winCpuLoad.php''' | ||
| − | < | + | <syntaxhighlight lang="php"> |
<?php | <?php | ||
$host = $argv[1]; | $host = $argv[1]; | ||
| Line 222: | Line 227: | ||
echo trim($output); | echo trim($output); | ||
?> | ?> | ||
| − | </ | + | </syntaxhighlight> |
run script บน shell | run script บน shell | ||
| Line 266: | Line 271: | ||
# ไปที่เมนู System Utilities เลือก View Cacti Log File จะมีรายละเอียดอยู่<br>[[File:Tshoot02.PNG]]<br>[[File:Tshoot03.PNG]] | # ไปที่เมนู System Utilities เลือก View Cacti Log File จะมีรายละเอียดอยู่<br>[[File:Tshoot02.PNG]]<br>[[File:Tshoot03.PNG]] | ||
# การปรับ Logging Level เป็น MEDUIM หรือสูงกว่าควรปรับเฉพาะต้องการแก้ไขปัญหา หลังจากแก้ไขเสร็จควรปรับเป็น LOW เนื้่องจากถ้ามีอุปกรณ์จำนวนมาก Log File จะใหญ่เกินไป | # การปรับ Logging Level เป็น MEDUIM หรือสูงกว่าควรปรับเฉพาะต้องการแก้ไขปัญหา หลังจากแก้ไขเสร็จควรปรับเป็น LOW เนื้่องจากถ้ามีอุปกรณ์จำนวนมาก Log File จะใหญ่เกินไป | ||
| + | |||
| + | == rrdtool == | ||
| + | [http://oss.oetiker.ch/rrdtool/ rrdtool] เป็นฐานข้อมูลแบบไฟล์ที่เก็บข้อมูลว่าในเวลาไหนข้อมูลมี่ค่าอะไร โดยจะต้องระบุระยะเวลาที่จะเก็บค่าต่าง ๆ ไว้ตั้งแต่ตอนสร้างฐานข้อมูลทำให้ให้มีโครงสร้างที่แน่นอนเพื่อให้เขียนอ่านข้อมูลได้รวดเร็ว | ||
| + | === การสร้างไฟล์ rrdtool === | ||
| + | [[File:Rrd creat 01.png|link=]]<br> | ||
| + | จากรูปเมื่อเปิด debug ดูไฟล์ rrdtool จะเห็นคำสั่งการสร้าง rrdtool โดยรูปแบบคือ <br> | ||
| + | /usr/bin/rrdtool create [path ของ file rrdtool] <br> | ||
| + | --step 300 คือช่วงเวลาที่จะเก็บข้อมูล 300 คือ ทุก 5 นาที<br><br> | ||
| + | ในส่วนของการประกาศ data source(ในนึกถึง field ในฐานข้อมูลทั่วไป)<br> | ||
| + | DS:[ชื่อของ data source]:[ชนิดของ data source]:[heartbeat]:[min]:[max]<br> | ||
| + | ชนิดของ data source โดยทั่วไปจะใช้อยู่สองชนิดคือ GAUGE และ COUNTER<br> | ||
| + | GAUGE คือค่าทั่วไป<br> | ||
| + | COUNTER คือค่าที่เพิ่มขึ้นเรื่อย ๆ โดย rrdtools จะคำนวนเองเมื่อมีการ overflow เกิดขึ้น<br> | ||
| + | heartbeat คือจำนวนวินาทีสูงสุดที่รับได้ระหว่างการอัพเดทค่าสองครั้งถ้าเกินค่าจะเป็น unknown<br><br> | ||
| + | ในส่วนของการประกาศ round robin archive (RRA) คือการระบุว่าจะเก็บข้อมูลแบบไหนด้วยความถี่แบบไหนจำนวนเท่าไหร่<br> | ||
| + | มีรูปแบบคือ RRA:{AVERAGE | MIN | MAX | LAST}:xff:steps:rows <br> | ||
| + | เช่น<br> | ||
| + | RRA:AVERAGE:0.5:1:600 คือเก็บค่าเฉลี่ย 1 step ไว้ 600 แถว ในที่นี้ step คือ 5 นาที คือเก็บข้อมูลทุก 5 นาทีไว้เป็นเวลา 2 วัน<br> | ||
| + | RRA:AVERAGE:0.5:6:700 คือเก็บค่าเฉลี่ย 6 step ไว้ 700 แถว ในที่นี้ step คือ 5 นาที คือเก็บข้อมูลเฉลี่ยทุก 30 นาทีไว้เป็นเวลา 14 วัน<br> | ||
| + | RRA:AVERAGE:0.5:24:775 คือเก็บค่าเฉลี่ย 24 step ไว้ 775 แถว ในที่นี้ step คือ 5 นาที คือเก็บข้อมูลเฉลี่ยทุก 2 ชั่วโมงไว้เป็นเวลา 2 เดือน<br> | ||
| + | RRA:AVERAGE:0.5:288:797 คือเก็บค่าเฉลี่ย 288 step ไว้ 797 แถว ในที่นี้ step คือ 5 นาที คือเก็บข้อมูลเฉลี่ยทุก 1 วันไว้เป็นเวลา 797 วัน<br> | ||
| + | ส่วน RRA ชนิด MAX ก็เก็บในลักษณธเดียวกันแต่เก็บค่าสูงสุด<br> | ||
| + | |||
| + | === การ update ค่าในไฟล์ rrdtool === | ||
| + | ใช้คำสั่ง rrdtool update เช่น<br> | ||
| + | rrdtool update /path/to/file.rrd -t ds1:ds2:ds3 N:4.5:U:9<br> | ||
| + | -t คือ template ชื่อ data source ที่จะทำการเพิ่มค่าตามลำดับ<br> | ||
| + | N คือเวลาปัจจุบันสามารถใส่เป็นค่า unix time stamp ได้และตามด้วยค่าที่จะเพิ่มใน data source ตามลำดับ<br> | ||
| + | จากตัวอย่างคือ เพิ่มค่า 4.5 ให้ data source ds1 ค่า unknown ให้ ds2 และ 9 ให้ ds3 ตามลำดับ โดยค่าฟิลด์เวลาเป็นเวลาปัจจุบัน<br> | ||
| + | เช่นถ้ารันคำสั่ง<br> | ||
| + | rrdtool update /path/to/file.rrd -t ds1:ds2:ds3 N:4.5:U:9<br> | ||
| + | rrdtool update /path/to/file.rrd -t ds1:ds2:ds3 N+300:7:6:5.7<br> | ||
| + | rrdtool update /path/to/file.rrd -t ds1:ds2:ds3 N+600:2.1:9:U<br> | ||
| + | ค่าใน rrdtool file ก็จะมีลักษณะเป็น | ||
| + | <pre> | ||
| + | |time |ds1|ds2|ds3| | ||
| + | ------------------- | ||
| + | |N |4.5|U |9 | | ||
| + | |N+300|7 |6 |5.7| | ||
| + | |N+600|2.1|9 |U | | ||
| + | </pre> | ||
| + | |||
| + | === การสร้างกราฟจากไฟล์ rrdtool === | ||
| + | [[File:Rrdtool graph 02.png|link=]]<br> | ||
| + | ใช้คำสั่ง rrdtool graph <br> | ||
| + | จะมีสามส่วนหลัก<br> | ||
| + | 1. ส่วนกำหนดลักษณะของกราฟเช่นชนิดของรูป ช่วงเวลาของข้อมูล ขนาดของรูปภาพ หัวข้อ คำอธิบายต่าง ๆ <br> | ||
| + | 2. ส่วนประกาศข้อมูลโดยใช้ DEF เพื่อประกาศข้อมูลโดยอ้างอิง path ของไฟล์ rrd ชื่อ data source และ rra ที่เก็บข้อมูล<br> | ||
| + | รวมถึงการนำ DEF ที่ประกาศมาเข้า function เพื่อนำไปแปลงค่าก่อนโดยใช้ CDEF ซึ่งเขียนด้วยภาษา RPN(Reverse Polish Notation) สามารถศึกษารายละเอียดได้ที่ [https://oss.oetiker.ch/rrdtool/tut/cdeftutorial.en.html cdeftutorial] จากตัวอย่าง CDEF ชื่อ cdefa มีค่าเท่ากับ DEF a x 8 เป็นต้น<br> | ||
| + | 3. ส่วนการนำข้อมูลมาพลอตกราฟโดยกำหนดคุณลักษณะไปด้วยว่าจะพลอตกราฟแบบไหน เช่น AREA กราฟทึบ, LINE กราฟเส้น, GPRINT กำหนดค่าสิ ตัวเลขจากข้อมูลที่จะเขียนลงในกราฟเป็นต้น ส่วนประกอบที่ประกาศจะถูกเขียนลงในกราฟตามลำดับ จากตัวอย่างนำเอา cdefa มาพลอดกราฟพื้นที่สี 00CF00 โดยใช้ชื่อว่า Inbound, นำเอา cdefe มาพลอตกราฟเส้นขนาด 1 ใช้ชื่อว่า Outbound สามารถศึกษารายละเอียดได้ที่ [https://oss.oetiker.ch/rrdtool/doc/rrdgraph_graph.en.html rrdgraph_graph] | ||
| + | <br> | ||
| + | |||
| + | === การดึงข้อมูลจาก rrdtool === | ||
| + | สามารถดึงข้อมูลจาก rrdtool file ออกมาแบบเป็นข้อความเพื่อนำไปใช้ประโยชน์อื่น ๆ โดยใช้คำสั่ง rrdtool graphv เช่น | ||
| + | <source> | ||
| + | rrdtool graphv - \ | ||
| + | --start -1d \ | ||
| + | --end now \ | ||
| + | DEF:in=e-learning_traffic_in_175.rrd:traffic_in:AVERAGE \ | ||
| + | DEF:out=e-learning_traffic_in_175.rrd:traffic_out:AVERAGE \ | ||
| + | CDEF:inb=in,8,* \ | ||
| + | CDEF:outb=out,8,* \ | ||
| + | PRINT:inb:AVERAGE:"Last day average inbound traffic \: %4.2lf %s" \ | ||
| + | PRINT:inb:MAX:"Last day max inbound traffic \: %4.2lf %s" \ | ||
| + | PRINT:outb:AVERAGE:"Last day average outbound traffic \: %4.2lf %s" \ | ||
| + | PRINT:outb:MAX:"Last day average outbound traffic \: %4.2lf %s" \ | ||
| + | </source> | ||
| + | จะได้ผลลัพธ์เป็น | ||
| + | <source> | ||
| + | print[0] = "Last day average inbound traffic : 1.17 M" | ||
| + | print[1] = "Last day max inbound traffic : 11.78 M" | ||
| + | print[2] = "Last day average outbound traffic : 42.38 k" | ||
| + | print[3] = "Last day average outbound traffic : 370.78 k" | ||
| + | </source> | ||
| + | |||
| + | === คำสั่งอื่น ๆ ของ rrdtool === | ||
| + | rrdtool info [path/to/file.rrd] แสดงข้อมูลของไฟล์ rrdtool | ||
| + | <source> | ||
| + | rrdtool info cmu_mis_1_traffic_in_220.rrd | ||
| + | filename = "cmu_mis_1_traffic_in_220.rrd" | ||
| + | rrd_version = "0003" | ||
| + | step = 300 | ||
| + | last_update = 1483936215 | ||
| + | header_size = 2912 | ||
| + | ds[traffic_in].index = 0 | ||
| + | ds[traffic_in].type = "COUNTER" | ||
| + | ds[traffic_in].minimal_heartbeat = 600 | ||
| + | ds[traffic_in].min = 0.0000000000e+00 | ||
| + | ds[traffic_in].max = 1.0000000000e+08 | ||
| + | ds[traffic_in].last_ds = "1121540562" | ||
| + | ds[traffic_in].value = 2.2166490048e+07 | ||
| + | ds[traffic_in].unknown_sec = 0 | ||
| + | ds[traffic_out].index = 1 | ||
| + | ds[traffic_out].type = "COUNTER" | ||
| + | ds[traffic_out].minimal_heartbeat = 600 | ||
| + | ds[traffic_out].min = 0.0000000000e+00 | ||
| + | ds[traffic_out].max = 1.0000000000e+08 | ||
| + | ds[traffic_out].last_ds = "2497746928" | ||
| + | ds[traffic_out].value = 4.9326521129e+06 | ||
| + | ds[traffic_out].unknown_sec = 0 | ||
| + | rra[0].cf = "AVERAGE" | ||
| + | rra[0].rows = 600 | ||
| + | rra[0].cur_row = 431 | ||
| + | rra[0].pdp_per_row = 1 | ||
| + | rra[0].xff = 5.0000000000e-01 | ||
| + | rra[0].cdp_prep[0].value = NaN | ||
| + | rra[0].cdp_prep[0].unknown_datapoints = 0 | ||
| + | rra[0].cdp_prep[1].value = NaN | ||
| + | rra[0].cdp_prep[1].unknown_datapoints = 0 | ||
| + | rra[1].cf = "AVERAGE" | ||
| + | rra[1].rows = 700 | ||
| + | rra[1].cur_row = 261 | ||
| + | rra[1].pdp_per_row = 6 | ||
| + | rra[1].xff = 5.0000000000e-01 | ||
| + | rra[1].cdp_prep[0].value = 0.0000000000e+00 | ||
| + | rra[1].cdp_prep[0].unknown_datapoints = 0 | ||
| + | rra[1].cdp_prep[1].value = 0.0000000000e+00 | ||
| + | rra[1].cdp_prep[1].unknown_datapoints = 0 | ||
| + | rra[2].cf = "AVERAGE" | ||
| + | rra[2].rows = 775 | ||
| + | rra[2].cur_row = 74 | ||
| + | rra[2].pdp_per_row = 24 | ||
| + | rra[2].xff = 5.0000000000e-01 | ||
| + | rra[2].cdp_prep[0].value = 5.4375483859e+06 | ||
| + | rra[2].cdp_prep[0].unknown_datapoints = 0 | ||
| + | rra[2].cdp_prep[1].value = 2.1998255954e+06 | ||
| + | rra[2].cdp_prep[1].unknown_datapoints = 0 | ||
| + | rra[3].cf = "AVERAGE" | ||
| + | rra[3].rows = 797 | ||
| + | rra[3].cur_row = 250 | ||
| + | rra[3].pdp_per_row = 288 | ||
| + | rra[3].xff = 5.0000000000e-01 | ||
| + | rra[3].cdp_prep[0].value = 2.4884340098e+07 | ||
| + | rra[3].cdp_prep[0].unknown_datapoints = 0 | ||
| + | rra[3].cdp_prep[1].value = 8.5183914983e+06 | ||
| + | rra[3].cdp_prep[1].unknown_datapoints = 0 | ||
| + | rra[4].cf = "MAX" | ||
| + | rra[4].rows = 600 | ||
| + | rra[4].cur_row = 555 | ||
| + | rra[4].pdp_per_row = 1 | ||
| + | rra[4].xff = 5.0000000000e-01 | ||
| + | rra[4].cdp_prep[0].value = NaN | ||
| + | rra[4].cdp_prep[0].unknown_datapoints = 0 | ||
| + | rra[4].cdp_prep[1].value = NaN | ||
| + | rra[4].cdp_prep[1].unknown_datapoints = 0 | ||
| + | rra[5].cf = "MAX" | ||
| + | rra[5].rows = 700 | ||
| + | rra[5].cur_row = 328 | ||
| + | rra[5].pdp_per_row = 6 | ||
| + | rra[5].xff = 5.0000000000e-01 | ||
| + | rra[5].cdp_prep[0].value = -inf | ||
| + | rra[5].cdp_prep[0].unknown_datapoints = 0 | ||
| + | rra[5].cdp_prep[1].value = -inf | ||
| + | rra[5].cdp_prep[1].unknown_datapoints = 0 | ||
| + | rra[6].cf = "MAX" | ||
| + | rra[6].rows = 775 | ||
| + | rra[6].cur_row = 530 | ||
| + | rra[6].pdp_per_row = 24 | ||
| + | rra[6].xff = 5.0000000000e-01 | ||
| + | rra[6].cdp_prep[0].value = 1.4701618228e+06 | ||
| + | rra[6].cdp_prep[0].unknown_datapoints = 0 | ||
| + | rra[6].cdp_prep[1].value = 3.7781759630e+05 | ||
| + | rra[6].cdp_prep[1].unknown_datapoints = 0 | ||
| + | rra[7].cf = "MAX" | ||
| + | rra[7].rows = 797 | ||
| + | rra[7].cur_row = 694 | ||
| + | rra[7].pdp_per_row = 288 | ||
| + | rra[7].xff = 5.0000000000e-01 | ||
| + | rra[7].cdp_prep[0].value = 2.3122971577e+06 | ||
| + | rra[7].cdp_prep[0].unknown_datapoints = 0 | ||
| + | rra[7].cdp_prep[1].value = 6.2837038061e+05 | ||
| + | rra[7].cdp_prep[1].unknown_datapoints = 0 | ||
| + | </source> | ||
| + | |||
| + | rrdtool tune แก้ไขคุณลักษณะพื้นฐานของ rrdtool ไฟล์ เช่นเปลี่ยนค่า max ของ data source | ||
| + | <source> | ||
| + | rrdtool tune cmu_mis_1_traffic_in_220.rrd --maximum traffic_in:10000000000 | ||
| + | </source> | ||
| + | ดูรายละเอียดเพิ่มเติมที่ [http://oss.oetiker.ch/rrdtool/doc/rrdtune.en.html rrdtune] | ||
| + | <br><br> | ||
| + | rrdtool fetch /path/to/file CF [option] ใช้สำหรับดึงข้อมูลจาก rrdtool โดยสามารถกำหนดช่วงเวลาและความละเอียดของข้อมูลที่จะดึงเช่น<br> | ||
| + | เช่นดึงข้อมูล 1 ชั่วโมงล่าสุด รายละเอียดเพิ่มเติม [http://oss.oetiker.ch/rrdtool/doc/rrdfetch.en.html rrdfetch] | ||
| + | <source> | ||
| + | rrdtool fetch cmu_mis_1_traffic_in_220.rrd AVERAGE -s -1h | ||
| + | traffic_in traffic_out | ||
| + | |||
| + | 1483938300: 4.7878977392e+05 2.2948069908e+04 | ||
| + | 1483938600: 4.6303544177e+05 1.8144105916e+04 | ||
| + | 1483938900: 5.7049617789e+05 3.4381264233e+04 | ||
| + | 1483939200: 1.4363576793e+05 9.4188391805e+03 | ||
| + | 1483939500: 1.3746872511e+05 7.1482584268e+03 | ||
| + | 1483939800: 7.6102433889e+04 5.1350154862e+03 | ||
| + | 1483940100: 7.6963376254e+04 4.5660090457e+03 | ||
| + | 1483940400: 2.2389588904e+05 8.3472855015e+03 | ||
| + | 1483940700: 8.0357268406e+04 6.6165589744e+03 | ||
| + | 1483941000: 7.9354790592e+04 5.1676141294e+03 | ||
| + | 1483941300: 7.7381791439e+04 5.3697185476e+03 | ||
| + | 1483941600: 1.1011794797e+05 5.8690860297e+03 | ||
| + | 1483941900: -nan -nan | ||
| + | </source> | ||
| + | <br> | ||
| + | <br> | ||
| + | rrdtoo xport สำหรับการส่งออกข้อมูลเป็น XML หรือ JSON โดยกำหนดค่าต่าง ๆ ที่จะ xport ลักษณะเดียวกันกับ rrdtool graph เช่น<br> | ||
| + | ส่งออกข้อมูลหนึ่งชั่งโมงที่แล้วของ traffic บน interface หนึ่ง รายละเอียดเพิ่มเติม [http://oss.oetiker.ch/rrdtool/doc/rrdxport.en.html rrdxport] | ||
| + | <source> | ||
| + | rrdtool xport \ | ||
| + | > --start -1h --end now \ | ||
| + | > DEF:in=cmu_mis_1_traffic_in_220.rrd:traffic_in:AVERAGE \ | ||
| + | > DEF:out=cmu_mis_1_traffic_in_220.rrd:traffic_out:AVERAGE \ | ||
| + | > CDEF:inb=in,8,* \ | ||
| + | > CDEF:outb=out,8,* \ | ||
| + | > CDEF:sum=inb,outb,+ \ | ||
| + | > XPORT:inb:"inboud traffic bits" \ | ||
| + | > XPORT:outb:"outbound traffic bits" \ | ||
| + | > XPORT:sum:"sum traffic bits" | ||
| + | <?xml version="1.0" encoding="ISO-8859-1"?> | ||
| + | |||
| + | <xport> | ||
| + | <meta> | ||
| + | <start>1483941000</start> | ||
| + | <step>300</step> | ||
| + | <end>1483941000</end> | ||
| + | <rows>13</rows> | ||
| + | <columns>3</columns> | ||
| + | <legend> | ||
| + | <entry>inboud traffic bits</entry> | ||
| + | <entry>outbound traffic bits</entry> | ||
| + | <entry>sum traffic bits</entry> | ||
| + | </legend> | ||
| + | </meta> | ||
| + | <data> | ||
| + | <row><t>1483941000</t><v>6.3483832474e+05</v><v>4.1340913035e+04</v><v>6.7617923777e+05</v></row> | ||
| + | <row><t>1483941300</t><v>6.1905433151e+05</v><v>4.2957748381e+04</v><v>6.6201207989e+05</v></row> | ||
| + | <row><t>1483941600</t><v>8.8094358375e+05</v><v>4.6952688238e+04</v><v>9.2789627199e+05</v></row> | ||
| + | <row><t>1483941900</t><v>7.7293905867e+05</v><v>4.4393500997e+04</v><v>8.1733255967e+05</v></row> | ||
| + | <row><t>1483942200</t><v>6.5026368605e+05</v><v>4.8573750071e+04</v><v>6.9883743613e+05</v></row> | ||
| + | <row><t>1483942500</t><v>8.8296087883e+05</v><v>5.8947372151e+04</v><v>9.4190825099e+05</v></row> | ||
| + | <row><t>1483942800</t><v>1.4140087788e+06</v><v>5.8672749534e+04</v><v>1.4726815283e+06</v></row> | ||
| + | <row><t>1483943100</t><v>4.3605659954e+06</v><v>1.7662720107e+05</v><v>4.5371931964e+06</v></row> | ||
| + | <row><t>1483943400</t><v>1.6980727508e+06</v><v>8.0145663509e+04</v><v>1.7782184143e+06</v></row> | ||
| + | <row><t>1483943700</t><v>1.1179436283e+06</v><v>7.7099348020e+04</v><v>1.1950429763e+06</v></row> | ||
| + | <row><t>1483944000</t><v>3.1598481289e+05</v><v>1.6592438133e+05</v><v>4.8190919422e+05</v></row> | ||
| + | <row><t>1483944300</t><v>6.4002246321e+05</v><v>5.5490625335e+04</v><v>6.9551308854e+05</v></row> | ||
| + | <row><t>1483944600</t><v>NaN</v><v>NaN</v><v>NaN</v></row> | ||
| + | </data> | ||
| + | </xport> | ||
| + | </source> | ||
| + | หรือ output แบบ json | ||
| + | <source> | ||
| + | rrdtool xport \ | ||
| + | > --start -1h --end now --json \ | ||
| + | > DEF:in=cmu_mis_1_traffic_in_220.rrd:traffic_in:AVERAGE \ | ||
| + | > DEF:out=cmu_mis_1_traffic_in_220.rrd:traffic_out:AVERAGE \ | ||
| + | > CDEF:inb=in,8,* \ | ||
| + | > CDEF:outb=out,8,* \ | ||
| + | > CDEF:sum=inb,outb,+ \ | ||
| + | > XPORT:inb:"inboud traffic bits" \ | ||
| + | > XPORT:outb:"outbound traffic bits" \ | ||
| + | > XPORT:sum:"sum traffic bits" | ||
| + | { about: 'RRDtool xport JSON output', | ||
| + | meta: { | ||
| + | start: 1483941600, | ||
| + | step: 300, | ||
| + | end: 1483941600, | ||
| + | legend: [ | ||
| + | 'inboud traffic bits', | ||
| + | 'outbound traffic bits', | ||
| + | 'sum traffic bits' | ||
| + | ] | ||
| + | }, | ||
| + | data: [ | ||
| + | [ 8.8094358375e+05, 4.6952688238e+04, 9.2789627199e+05 ], | ||
| + | [ 7.7293905867e+05, 4.4393500997e+04, 8.1733255967e+05 ], | ||
| + | [ 6.5026368605e+05, 4.8573750071e+04, 6.9883743613e+05 ], | ||
| + | [ 8.8296087883e+05, 5.8947372151e+04, 9.4190825099e+05 ], | ||
| + | [ 1.4140087788e+06, 5.8672749534e+04, 1.4726815283e+06 ], | ||
| + | [ 4.3605659954e+06, 1.7662720107e+05, 4.5371931964e+06 ], | ||
| + | [ 1.6980727508e+06, 8.0145663509e+04, 1.7782184143e+06 ], | ||
| + | [ 1.1179436283e+06, 7.7099348020e+04, 1.1950429763e+06 ], | ||
| + | [ 3.1598481289e+05, 1.6592438133e+05, 4.8190919422e+05 ], | ||
| + | [ 6.4002246321e+05, 5.5490625335e+04, 6.9551308854e+05 ], | ||
| + | [ 3.6522159788e+06, 1.7025369186e+05, 3.8224696706e+06 ], | ||
| + | [ 4.7051387011e+06, 1.7940220014e+05, 4.8845409013e+06 ], | ||
| + | [ null, null, null ] | ||
| + | ] | ||
| + | } | ||
| + | </source> | ||
== การ Import Template : ยกตัวอย่าง ApacheStats == | == การ Import Template : ยกตัวอย่าง ApacheStats == | ||
| Line 337: | Line 629: | ||
ln -s /usr/share/cacti/site/lib /usr/local/share/cacti/lib | ln -s /usr/share/cacti/site/lib /usr/local/share/cacti/lib | ||
</source> | </source> | ||
| + | |||
| + | == ปรับแต่ง postfix mail server สำหรับส่งอีเมล == | ||
| + | === ติดตั้ง postfix === | ||
| + | <source lang="bash"> | ||
| + | apt-get install postfix | ||
| + | </source> | ||
| + | |||
| + | === ใช้ gmail หรือ hotmail เป็น relay host === | ||
| + | โดยปกติหน่วยงานที่มีระบบอีเมลเป็นของตัวเองก็สามารถใช้อีเมลภายในหน่สยงานได้ กรณีต้องการใช้ MTA ภายนอกเช่น gmail หรือ hotmail ก็สามารถทำได้ซึ่งจะสามารถส่งได้จำกัดจำนวนฉบับต่อวัน | ||
| + | smtp server ที่ใช้งานได้คือ ซึ่งใช้งานเป็น smtp บน tls | ||
| + | * '''smtp.gmail.com:587''' | ||
| + | * '''smtp.live.com:587''' | ||
| + | |||
| + | === สร้างไฟล์รหัสผ่านทำหรับ log in เข้าใช้ smtp === | ||
| + | * สร้างไฟล์ '''/etc/postfix/sasl_passwd''' | ||
| + | <source lang="bash"> | ||
| + | [smtp host] [email address]:[password] | ||
| + | เช่น | ||
| + | smtp.gmail.com user@gmail.com:passwd | ||
| + | </source> | ||
| + | |||
| + | * สร้าง hash ของรหัสผ่านแล้วลบรหัสผ่านแบบ plain text | ||
| + | <source lang="bash"> | ||
| + | postmap /etc/postfix/sasl_passwd | ||
| + | rm /etc/postfix/sasl_passwd | ||
| + | chmod 400 /etc/postfix/sasl_passwd.db | ||
| + | </source> | ||
| + | |||
| + | * แก้ไขไฟล์ '''/etc/postfix/main.cf''' | ||
| + | <source lang="bash"> | ||
| + | เพิ่มบรรทัด | ||
| + | smtp_sasl_auth_enable = yes | ||
| + | smtp_sasl_password_maps = hash:/etc/postfix/sasl_passwd | ||
| + | smtp_sasl_security_options = noanonymous | ||
| + | smtp_sasl_tls_security_options = noanonymous | ||
| + | smtp_use_tls = yes | ||
| + | แก้บรรทัด | ||
| + | relayhost = [smtp host]:587 | ||
| + | </source> | ||
| + | restart postfix | ||
| + | <source lang="bash"> | ||
| + | service postfix restart | ||
| + | </source> | ||
| + | |||
| + | * กรณีใช้ gmail เป็น smtp ต้องไปที่หน้า [https://myaccount.google.com/security#connectedapps https://myaccount.google.com/security#connectedapps] เพื่อเปิดใช้งาน less secure app | ||
| + | [[File:Postfix01.PNG|link=]] | ||
== cacti plugin : settings == | == cacti plugin : settings == | ||
| + | เป็น plugin พื้นฐานในการตั้งค่าต่าง ๆ เพิ่มเติมเช่นส่งอีเมล Download plugin [http://docs.cacti.net/plugin:settings http://docs.cacti.net/plugin:settings] | ||
| + | === ติดตั้ง === | ||
| + | <source lang="bash"> | ||
| + | cd /tmp | ||
| + | curl -O http://myweb.cmu.ac.th/supawit.w/cacti/uninet/settings-v0.71-1.tgz | ||
| + | tar zxvf settings-v0.71-1.tgz | ||
| + | mv settings /usr/local/share/cacti/plugins/ | ||
| + | </source> | ||
| + | |||
| + | === เปิดใช้งาน === | ||
| + | * ที่เมนู Plugin Management จะเห็น plugin ที่ติดตั้ง ให้คลิก Install และ Enable Plugin | ||
| + | [[File:PluginSettings01.PNG|link=]] | ||
| + | [[File:PluginSettings02.PNG|link=]] | ||
| + | |||
| + | === ตั้งค่าอีเมล === | ||
| + | * ที่เมนู Settings แท็บ Mail / DNS ให้ระบุค่าเกี่ยวกับ Email server และ DNS server จากนั้นกด Save และทดสอบส่งอีเมลโดยคลิกที่ Send a Test Email | ||
| + | [[File:PluginSettings03.PNG|link=]] | ||
| + | |||
| + | == cacti plugin : thold == | ||
| + | เป็น plugin สำหรับแจ้งเตือนเห็นการต่าง ๆ ดาวน์โหลดไฟล์ plugin ได้ที่ [http://docs.cacti.net/plugin:thold http://docs.cacti.net/plugin:thold] | ||
| + | === ติดตั้ง === | ||
| + | <source lang="bash"> | ||
| + | cd /tmp | ||
| + | curl -O http://myweb.cmu.ac.th/supawit.w/cacti/uninet/thold-v0.5.0.tgz | ||
| + | tar zxvf thold-v0.5.0.tgz | ||
| + | mv thold /usr/local/share/cacti/plugins/ | ||
| + | </source> | ||
| + | |||
| + | === เปิดใช้งาน === | ||
| + | * ที่เมนู Plugin Management จะเห็น plugin ที่ติดตั้ง ให้คลิก Install และ Enable Plugin | ||
| + | [[File:PluginThold01.PNG|link=]]<br> | ||
| + | [[File:PluginThold02.PNG|link=]] | ||
| + | |||
| + | === ตั้งค่า thold === | ||
| + | * ที่เมนู Settings แท็บ Thresholds | ||
| + | [[File:PluginThold03.PNG|link=]]<br> | ||
| + | [[File:PluginThold04.PNG|link=]] | ||
| + | |||
| + | === สร้าง notification list === | ||
| + | * ที่เมนู Notification Lists คลิก Add | ||
| + | [[File:PluginThold05.PNG|link=]]<br> | ||
| + | [[File:PluginThold06.PNG|link=]] | ||
| + | |||
| + | === สร้าง Threshold === | ||
| + | ที่เมนูของกราฟคลิกสร้าง Threshold เลือก Data source ที่จะทำการแจ้งเตือน<br> | ||
| + | [[File:PluginThold07.PNG|link=]]<br> | ||
| + | [[File:PluginThold08.PNG|link=]]<br> | ||
| + | [[File:PluginThold09.PNG|link=]]<br> | ||
| + | |||
| + | กำหนดค่าต่าง ๆ ของ Threshold<br> | ||
| + | [[File:PluginThold10.PNG|link=]] | ||
| + | |||
| + | ดู Threshold<br> | ||
| + | [[File:PluginThold11.PNG|link=]] | ||
| + | |||
| + | === ตั้งค่าให้ Thold แจ้งเตือนเมื่อ Host up/down === | ||
| + | ไปที่เมนู Devices เลือกอุปกรณ์ และเลือก notification list ที่จะแจ้งเตือน หรือค่าเริ่มต้นจะเป็น Global List ซึ่งตั้งค่าได้ที่ Settings -> Threshold -> Email Options | ||
| + | [[File:PluginThold12.PNG|link=]] | ||
| + | |||
| + | == cacti plugin : nectar == | ||
| + | เป็น plugin ที่ส่ง report ของกราฟต่าง ๆ ให้อัตโนมัติ Download plugin [http://docs.cacti.net/plugin:nectar http://docs.cacti.net/plugin:nectar] | ||
| + | === ติดตั้ง === | ||
| + | <source lang="bash"> | ||
| + | cd /tmp | ||
| + | curl -O http://myweb.cmu.ac.th/supawit.w/cacti/uninet/nectar-v0.35a.tgz | ||
| + | tar zxvf nectar-v0.35a.tgz | ||
| + | mv nectar /usr/local/share/cacti/plugins/ | ||
| + | </source> | ||
| + | |||
| + | === เปิดใช้งาน === | ||
| + | ที่เมนู Plugin Management จะเห็น plugin ที่ติดตั้ง ให้คลิก Install และ Enable Plugin<br> | ||
| + | [[File:PluginNectar01.PNG|link=]]<br> | ||
| + | [[File:PluginNectar02.PNG|link=]] | ||
| + | |||
| + | === สร้าง Report === | ||
| + | # ที่แท็บ nectar คลิก Add <br>[[File:PluginNectar03.PNG|link=]] | ||
| + | # ตั้งค่าของ Report แล้วคลิก Create <br>[[File:PluginNectar04.PNG|link=]] | ||
| + | # เพิ่มกราฟเข้าไปใน Report ไปที่แท็บ Items แล้วคลิก Add<br>[[File:PluginNectar05.PNG|link=]] | ||
| + | # ระบุรายละเอียดการเลือกกราฟที่จะเพิ่มใน Report สามารถเพิ่มกราฟได้หลายชุดโดยการคลิด Add <br>[[File:PluginNectar06.PNG|link=]]<br>[[File:PluginNectar07.PNG|link=]] | ||
| + | # สามารถคลิก Preview เพื่อดูตัวอย่าง Report, Events เพื่อดูกำหนดการส่ง Report และ Send Report เพื่อส่ง Report ทันที<br>[[File:PluginNectar08.PNG|link=]]<br>[[File:PluginNectar09.PNG|link=]] | ||
| + | |||
| + | == cacti plugin : weathermap == | ||
| + | เป็น plugin ที่สร้างแผนที่/แผนฝังการเชื่อมต่อของอุปกรณ์ต่าง ๆ โดยใช้ข้อมูลจาก cacti เพื่อแสดงข้อมูลแบบ real-time Download plugin [http://network-weathermap.com http://network-weathermap.com] | ||
| + | === ติดตั้ง === | ||
| + | ทำการติดตั้ง library ที่จำเป็นและตั้งค่า permission ของ directory เพื่อให้สามารถสร้างรูปภาพแผนที่ได้ | ||
| + | <source lang="bash"> | ||
| + | apt-get install php5-gd | ||
| + | service apache2 restart | ||
| + | cd /tmp | ||
| + | curl -O http://myweb.cmu.ac.th/supawit.w/cacti/uninet/php-weathermap-0.98.zip | ||
| + | unzip php-weathermap-0.98.zip | ||
| + | mv weathermap /usr/local/share/cacti/plugins/ | ||
| + | chmod 770 /usr/local/share/cacti/plugins/weathermap/{configs,output} | ||
| + | chgrp www-data /usr/local/share/cacti/plugins/weathermap/{configs,output} | ||
| + | </source> | ||
| + | |||
| + | === เปิดใช้งาน === | ||
| + | ที่เมนู Plugin Management จะเห็น plugin ที่ติดตั้ง ให้คลิก Install และ Enable Plugin<br> | ||
| + | [[File:PluginWeather01.PNG|link=]]<br> | ||
| + | [[File:PluginWeather02.PNG|link=]] | ||
| + | |||
| + | === ตั้งค่า === | ||
| + | ที่เมนู settings จะมีส่วนของ weathermap เพิ่มขึ้นมา<br> | ||
| + | [[File:PluginWeather03.PNG|link=]] | ||
| + | |||
| + | === editor === | ||
| + | ที่เมนู Weathermaps คลิก Weathermap Editor จากนั้นให้ตั้งชื่อไฟล์ map โดยต้องตั้งนามสกุลไฟล์เป็น .conf เสมอ<br> | ||
| + | [[File:PluginWeather04.PNG|link=]]<br> | ||
| + | [[File:PluginWeather05.PNG|link=]] | ||
| + | |||
| + | === Map Properties and Map Style === | ||
| + | ที่เมนนูของ editor สามารถกำหนดค่าต่าง ๆ ของ map ได้<br> | ||
| + | [[File:PluginWeather06.PNG|link=]]<br> | ||
| + | [[File:PluginWeather07.PNG|link=]] | ||
| + | |||
| + | === เพิ่ม map ลง cacti === | ||
| + | ที่เมนู Weathermaps คลิก Add แล้วเลือก map ที่ต้องการแล้วคลิก Add<br> | ||
| + | [[File:PluginWeather08.PNG|link=]]<br> | ||
| + | [[File:PluginWeather09.PNG|link=]]<br> | ||
| + | กำหนดให้ทุกคนสามารถเห็น map ได้ที่ Accessible by คลิกที่ admin จากนั้นเลือก Anyone แล้วคลิก Update<br> | ||
| + | [[File:PluginWeather10.PNG|link=]]<br> | ||
| + | [[File:PluginWeather11.PNG|link=]]<br> | ||
| + | [[File:PluginWeather12.PNG|link=]] | ||
| + | |||
| + | === เพิ่ม node === | ||
| + | [[File:PluginWeather13.PNG|link=]]<br> | ||
| + | เพิ่มรายละเอียด node สามารถคลิกที่ปุ่ม Edit เพื่อแก้ไข configuration ของ node โดยตรงได้<br> | ||
| + | [[File:PluginWeather14.PNG|link=]]<br> | ||
| + | |||
| + | === relative position === | ||
| + | ตั้งค่า Editor ให้แสดงเส้น relative<br> | ||
| + | [[File:PluginWeather16.PNG|link=]]<br> | ||
| + | การเพิ่ม node ควรใช้ตำแหน่งของ node ใหม่อ้างอิงจาก node เดิมจะทำให้การแก้ไข map แผนที่ทำได้ง่าย สามารถทำได้โดยแก้ไข configuration ของ node โดยระบุ ชื่อของ node หลัก และระยะห่างจาก node หลักในแกน x และแกน y ตามลำดับ | ||
| + | [[File:PluginWeather15.PNG|link=]]<br> | ||
| + | [[File:PluginWeather17.PNG|link=]] | ||
| + | |||
| + | === เพิ่ม link === | ||
| + | คลิกที่ Add link จากนั้นคลิกที่ node ต้นทางแล้วคลิกที่ node ปลายทาง (ควรให้ node ต้นทางเป็นอุปกรณ์ที่อยู่ขอบ และ node ปลายทางอยู่ core เนื่องจากถ้ามีการเปลี่ยน core จะต้องมาแก้ไข link ทั้งหมด)<br> | ||
| + | [[File:PluginWeather18.PNG|link=]]<br> | ||
| + | คลิกที่ link จากนั้นเลือกกราฟที่จะใช้แสดงข้อมูลบน link กราฟที่เลือกต้องเป็นกราฟของ node ต้นทาง<br> | ||
| + | [[File:PluginWeather19.PNG|link=]]<br> | ||
| + | |||
| + | |||
| + | === Legend and Timestamp === | ||
| + | คลิกที่ Position Legend หรือ Position Timestamp แล้วคลิกบนแผนที่เพื่อระบุตำแหน่ง<br> | ||
| + | [[File:PluginWeather20.PNG|link=]]<br> | ||
| + | |||
| + | === Edit link === | ||
| + | สามารถย้ายจุดกำเนิดของ link ได้โดยระบุ offset ที่ node<br> | ||
| + | [[File:PluginWeather21.PNG|link=]]<br> | ||
| + | [[File:PluginWeather22.PNG|link=]]<br> | ||
| + | <br> | ||
| + | สารมารกำหนดตำแหน่งที่ให้ link ผ่านได้โดยใช้ parameter VIA โดยค่าของตำแหน่งจะเป็น absolute หรือ relative ก็ได้<br> | ||
| + | [[File:PluginWeather23.PNG|link=]]<br> | ||
| + | [[File:PluginWeather24.PNG|link=]]<br> | ||
| + | <br> | ||
| + | สามารถเปลี่ยนรูปแบบ link ได้โดยใช้ parameter VIASTYLE angled<br> | ||
| + | [[File:PluginWeather25.PNG|link=]]<br> | ||
| + | [[File:PluginWeather26.PNG|link=]]<br> | ||
| + | |||
| + | === Host status legend === | ||
| + | แก้ไขไฟล์ configuration ของ map '''/usr/local/share/cacti/plugins/weathermap/configs/cacti.conf'''<br> เพิ่มบรรทัดต่อท้าย global section | ||
| + | <source lang="text"> | ||
| + | KEYPOS host 50 50 Host Status | ||
| + | KEYSTYLE host tags 250 | ||
| + | SCALE host 0 0.5 192 192 192 Disabled | ||
| + | SCALE host 0.5 1.5 255 128 128 Down | ||
| + | SCALE host 1.5 2.5 128 128 255 Recovering | ||
| + | SCALE host 2.5 3.5 128 255 128 Up | ||
| + | |||
| + | # End of global section | ||
| + | </source> | ||
| + | |||
| + | คลิกที่ node เพิ่ม parameter '''TARGET cactihost:[host id]''' host id คือ id ของ host ของ cacti และ '''USESCALE host in''' host คือชื่อ SCALE ที่ประกาศไว้ในขั้นตอนก่อนหน้า<br> | ||
| + | [[File:PluginWeather28.PNG|link=]]<br> | ||
| + | [[File:PluginWeather27.PNG|link=]]<br> | ||
| + | <br> | ||
| + | สีของ node จะเปลี่ยนตามสถานะของ host บน cacti<br> | ||
| + | [[File:PluginWeather29.PNG|link=]]<br> | ||
| + | |||
| + | == Lab VM image == | ||
| + | [https://drive.google.com/drive/folders/0B_QxoaXK_QzKaG9ubExDTTFRajg VM image] | ||
| + | |||
| + | == ผู้เขียน == | ||
| + | ศุภวิทย์ วรรณภิละ<br> | ||
| + | CCNA,RHCE<br> | ||
| + | สำนักบริการเทคโนโลยีสารสนเทศ มหาวิทยาลัยเชียงใหม่<br> | ||
| + | supawit.w@cmu.ac.th<br> | ||
Latest revision as of 10:59, 11 January 2017
SNMP
- เป็น protocol มาตรฐานบนอุปกรณ์เครือข่ายที่ใช้บริหารจัดการอุปกรณ์เช่นการอ่านค่าต่าง ๆ จากอุปกรณ์หรือส่งคำสั่งเพื่อเปลี่ยนแปลงค่าต่าง ๆ ของอุปกรณ์
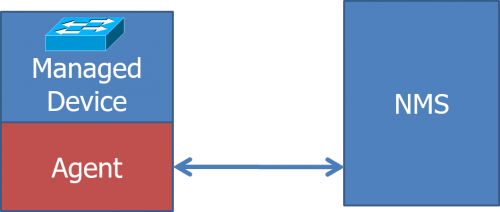
- โดยมี Network Management System(NMS) ติดตั้งซอฟท์แวร์สำหรับการจัดการ โดยติดต่อไปที่ SNMP agent ที่อยู่บนอุปกรณ์ที่เป็น Managed Device เช่น Router, Switch, Server host เป็นต้น
- SNMP Agent จะเปิดให้บริการที่ UDP Port 161
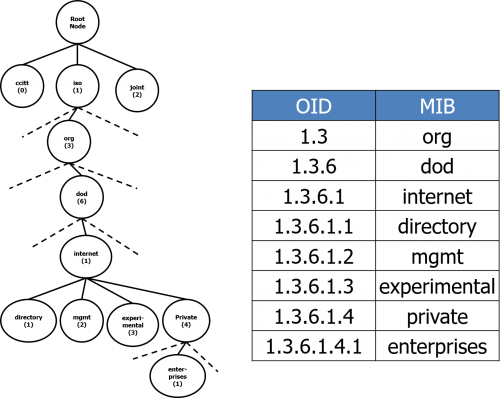
- การเข้าถึงข้อมูลต่าง ๆ บน SNMP Agent จะอ้างอิงผ่าน Object identifier(OID) หรือ Management Information Base(MIB) ซึ่งข้อมูลค่าต่าง ๆ จะถูกเก็บไว้เป็นโครงสร้าง tree และมี index เชื่อมกันในแต่ละกิ่งของข้อมูล
snmpd
- snmpd เป็น service ที่เป็น snmp agent บน Linux host (ในที่นี้ใช้ Ubuntu 14.04.4) ติดตั้งโดยใช้คำสั่ง
apt-get install snmp snmpd snmp-mibs-downloader
- แก้ไขไฟล์ /etc/snmp/snmpd.conf เพื่อกำหนดค่า community string และเปิดให้ remote NMS สามารถดึงข้อมูลได้
#agentAddress udp:127.0.0.1:161
agentAddress udp:161

rocommunity [community string]  default
- restart snmpd
service snmpd restart
- แก้ไขไฟล์ /etc/snmp/snmp.conf เพื่อเปิดใช้งาน mibs ทั้งหมด โดยการ comment บรรทัด
#mibs:
การดึงข้อมูลจาก SNMP
- snmpget
ดึงข้อมูลจาก snmp agent ผ่าน OID หรือ MIB
รูปแบบคำสั่งเป็น snmpget [OPTIONS] AGENT OID [OID] …
โดยมี options ที่สำคัญคือ
-v : เวอร์ชั่นของ snmp {1, 2c, 3}
-c : community string
-On : แสดง OID เป็นตัวเลขแทน MIB
snmpget -v 2c -c [community string] [agent ip] sysName.0
SNMPv2-MIB::sysName.0 = STRING: ubuntu

snmpget -v 2c -c [community string] -On [agent ip] sysName.0
.1.3.6.1.2.1.1.5.0 = STRING: ubuntu
- snmpgetnext
ดึงข้อมูลแรกถัดจาก OID ที่ระบุ
snmpgetnext -v 2c -c [community string] [agent ip] .
SNMPv2-MIB::sysDescr.0 = STRING: Linux ubuntu 3.13.0-46-generic #79-Ubuntu SMP Tue Mar 10 20:06:50 UTC 2015 x86_64

snmpget -v 2c -c [community string] -On [agent ip] .
.1.3.6.1.2.1.1.1.0 = STRING: Linux ubuntu 3.13.0-46-generic #79-Ubuntu SMP Tue Mar 10 20:06:50 UTC 2015 x86_64
- snmpwalk
ดึงข้อมูลทั้งหมดถัดจาก OID ที่ระบุ
snmpwalk -v 2c -c qwerty localhost interface
IF-MIB::ifNumber.0 = INTEGER: 2
IF-MIB::ifIndex.1 = INTEGER: 1
IF-MIB::ifIndex.2 = INTEGER: 2
IF-MIB::ifDescr.1 = STRING: lo
IF-MIB::ifDescr.2 = STRING: eth0
IF-MIB::ifType.1 = INTEGER: softwareLoopback(24)
IF-MIB::ifType.2 = INTEGER: ethernetCsmacd(6)
IF-MIB::ifMtu.1 = INTEGER: 65536
IF-MIB::ifMtu.2 = INTEGER: 1500
IF-MIB::ifSpeed.1 = Gauge32: 10000000
IF-MIB::ifSpeed.2 = Gauge32: 1000000000
IF-MIB::ifPhysAddress.1 = STRING:
IF-MIB::ifPhysAddress.2 = STRING: 8:0:27:34:e1:8f
IF-MIB::ifAdminStatus.1 = INTEGER: up(1)
IF-MIB::ifAdminStatus.2 = INTEGER: up(1)
IF-MIB::ifOperStatus.1 = INTEGER: up(1)
IF-MIB::ifOperStatus.2 = INTEGER: up(1)
IF-MIB::ifLastChange.1 = Timeticks: (0) 0:00:00.00
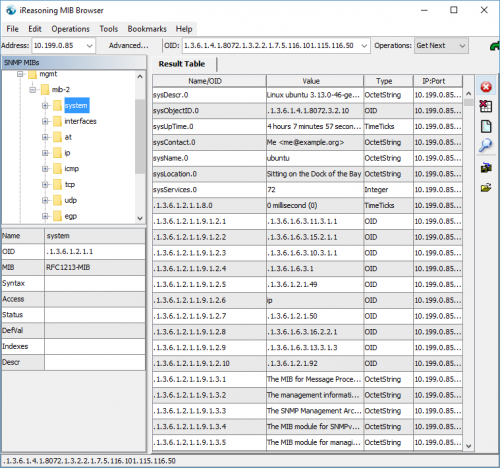
- GUI snmp client
http://www.ireasoning.com Free MIB Browser
cacti
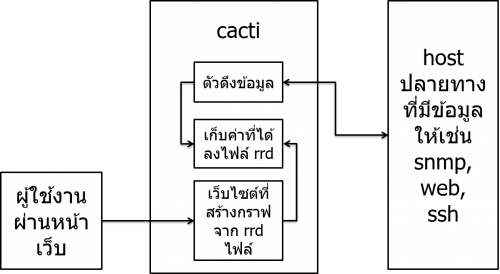
เป็นระบบ monitoring ที่ใช้ rrdtool เก็บข้อมูลและทำกราฟทำให้ทำงานได้เร็ว มี template หลากหลาย ดึงข้อมูลแบบปรับแต่งเองได้หลากหลาย มี plugins ให้ใช้งานและจัดการผู้ใช้ได้ http://cacti.net
ติดตั้ง cacti
apt-get install cacti

ให้ตั้งรหัสผ่านของ mysql root user
เลือก apache2 เป็น http server
ระบุรหัสผ่านของ mysql root
ตั้งค่ารหัสผ่านของ mysql cacti user
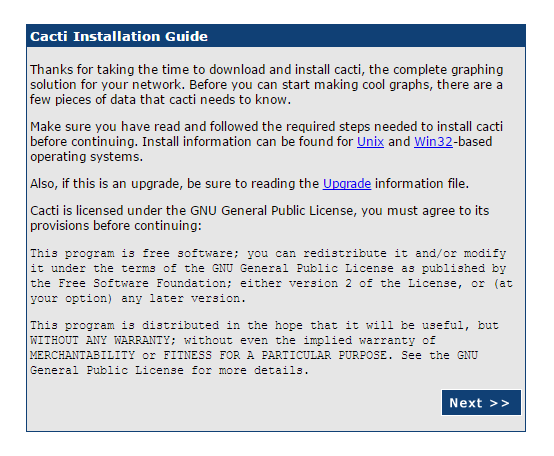
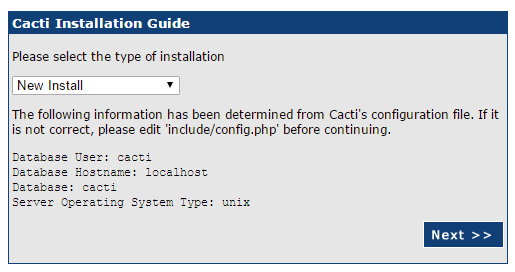
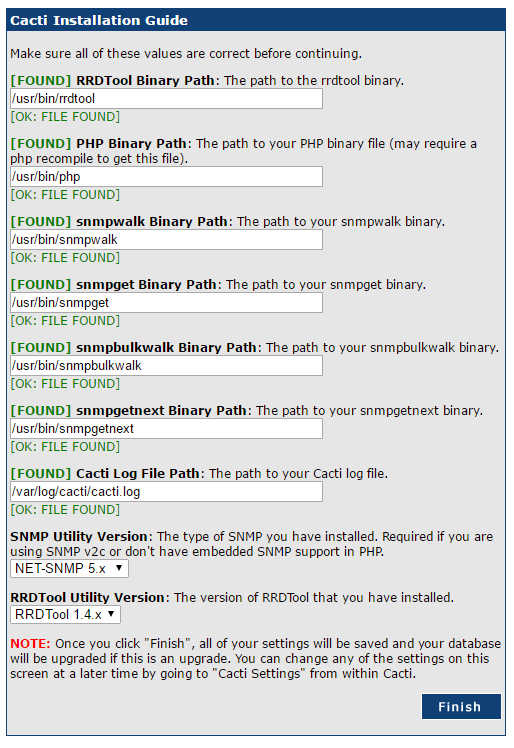
จากนั้นเรียก cacti ผ่าน browser http://[ip or hostname]/cacti และทำตามขั้นตอน ใช้ username และ password เริ่มต้นเป็น admin และตั้งค่ารหัสผ่านใหม่
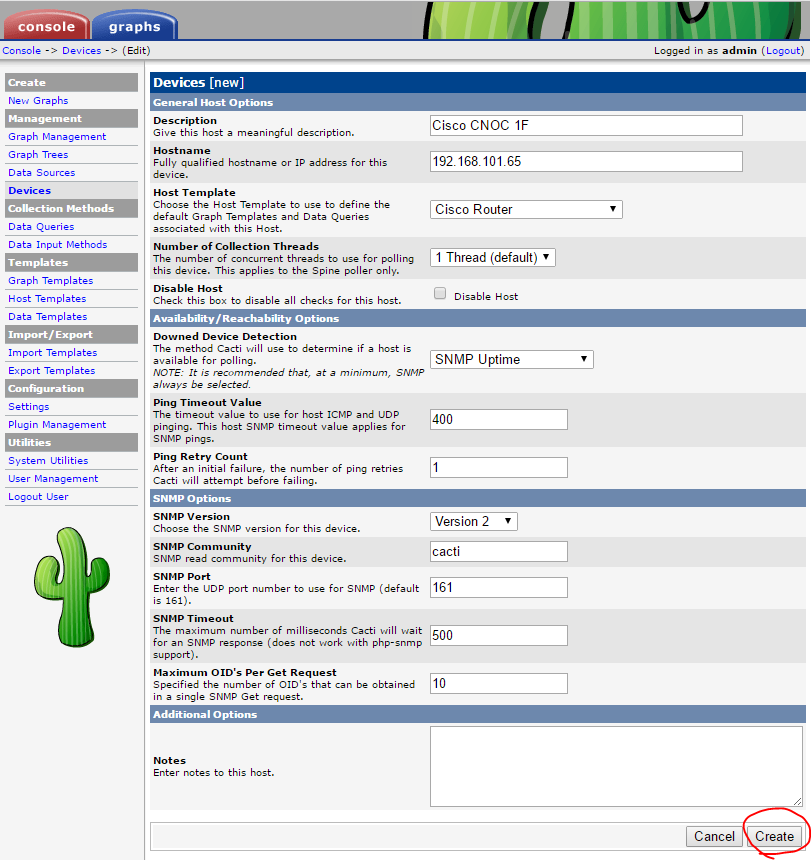
เพิ่มอุปกรณ์ประเภท switch
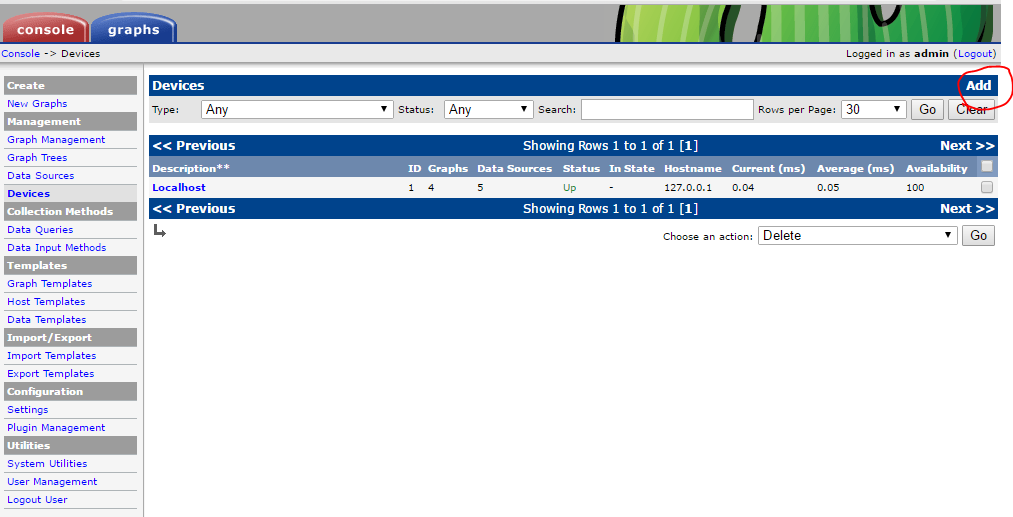
เพิ่มอุปกรณ์
- คลิก Add
- ระบุข้อมูล SNMP ของอุปกรณ์ปลายทาง
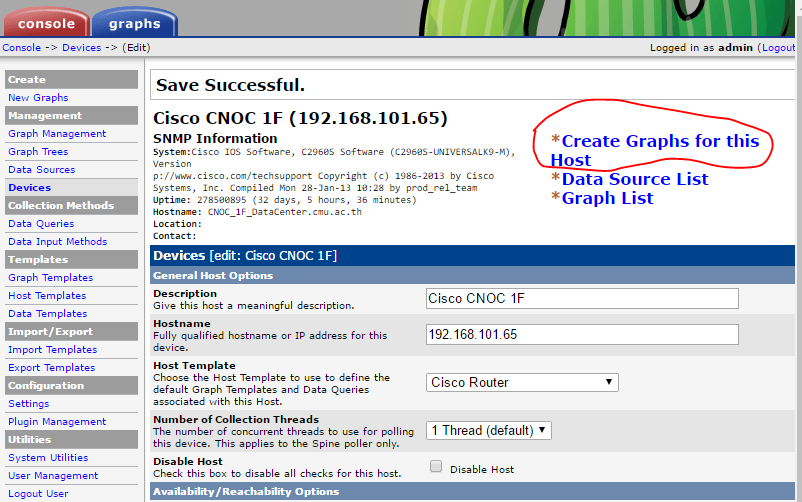
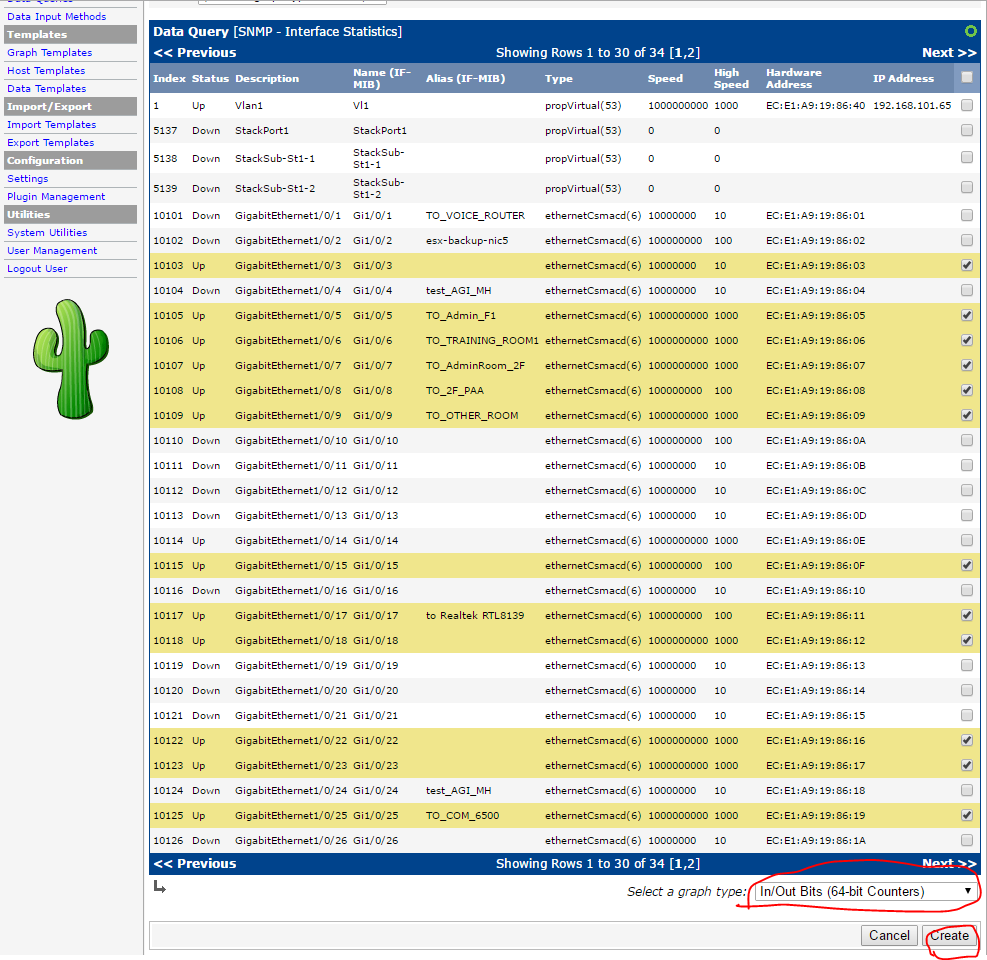
สร้างกราฟ
- คลิก Create Graphs for this host
- เลือก 64bits counter สำหรับ Gigabits Interface
สร้าง graph tree
- คลิก Graph Trees แล้วคลิก Add
- ระบุรายละเอียด tree แล้วคลิก Create
เพิ่มอุปกรณ์ลงใน tree
- เลือกอุปกรณ์ที่จะเพิ่มลง tree แล้วเลือก Place on a Tree(ชื่อ tree) แล้วคลิก Go
- เลือกที่อยู่ใน tree แล้วคลิก Continue
ดูกราฟ
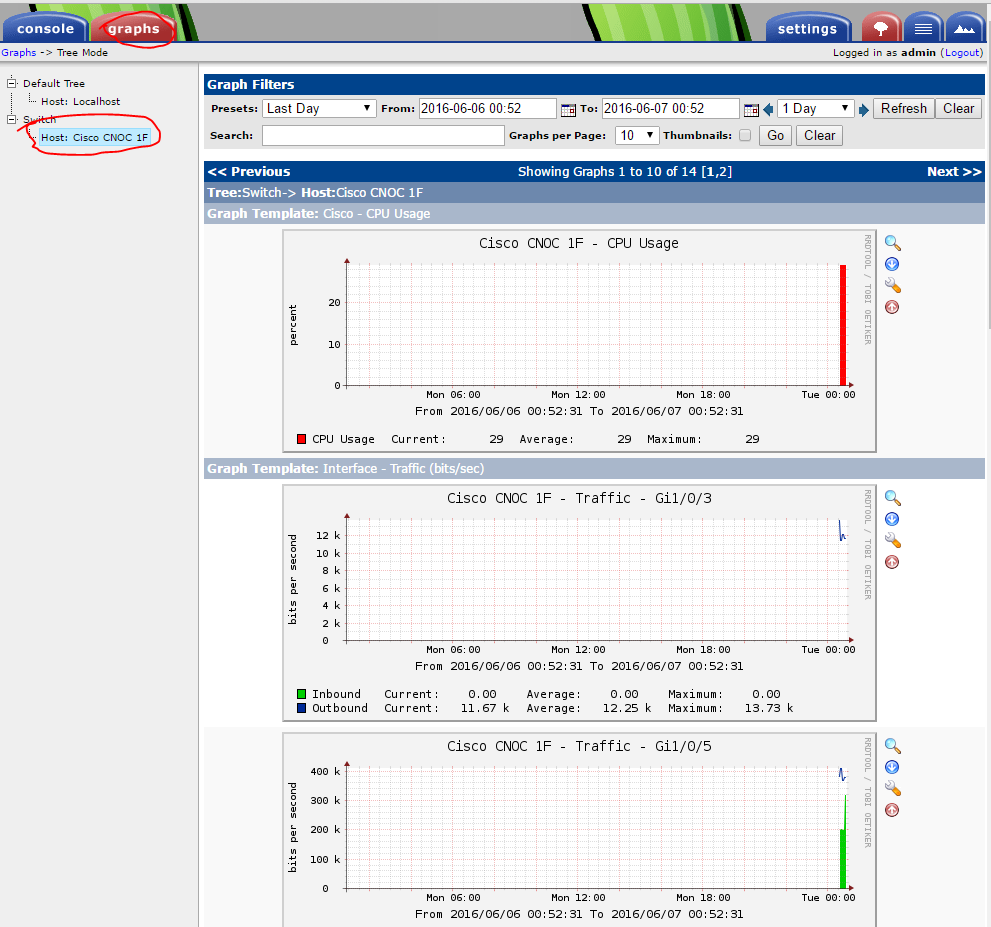
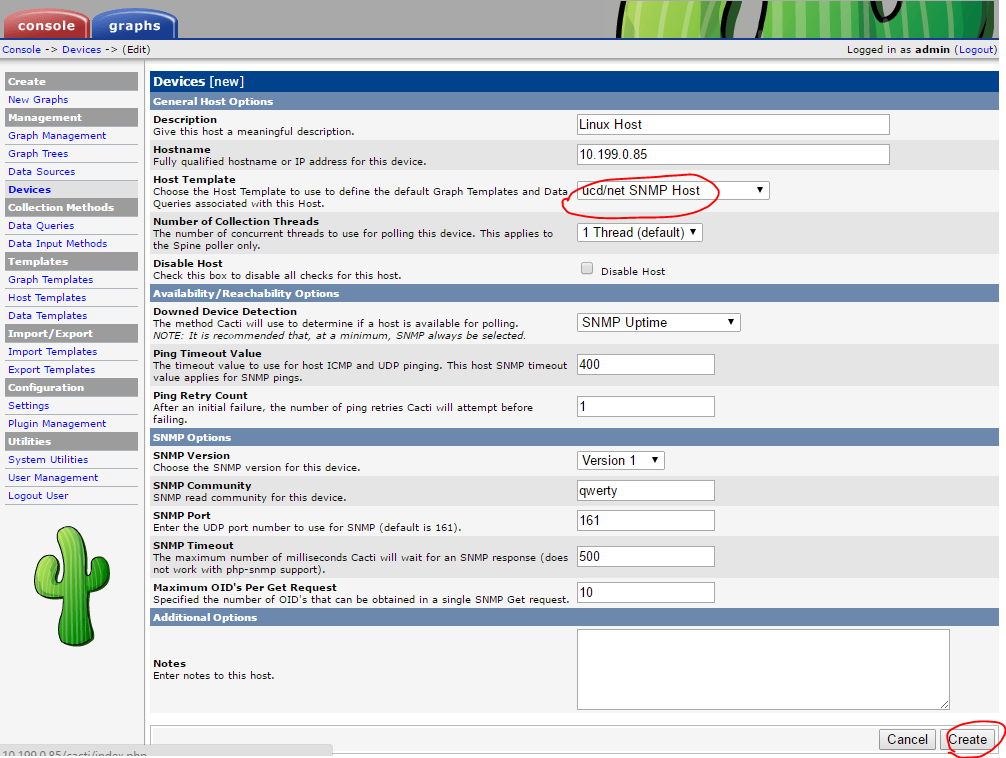
เพิ่มอุปกรณ์ประเภท Linux host
เพิ่มอุปกรณ์
- คลิก Add
- ระบุข้อมูล SNMP ของอุปกรณ์ปลายทาง
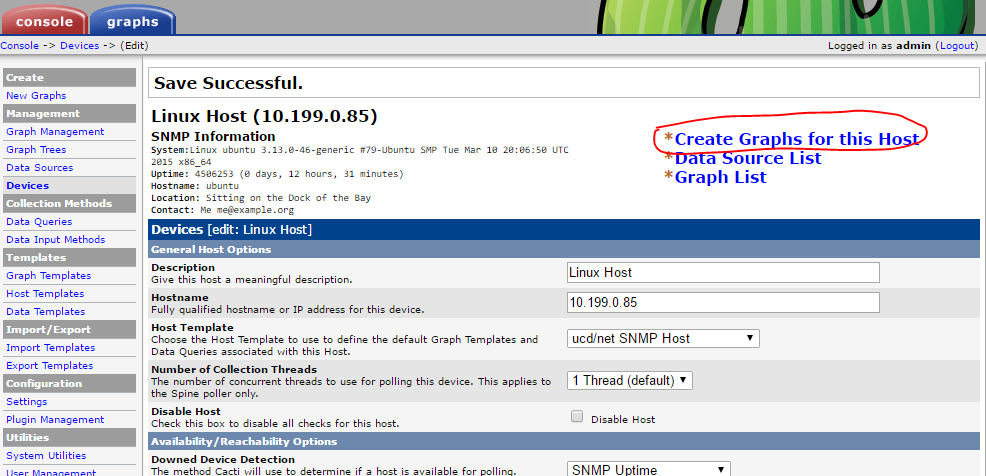
สร้างกราฟ
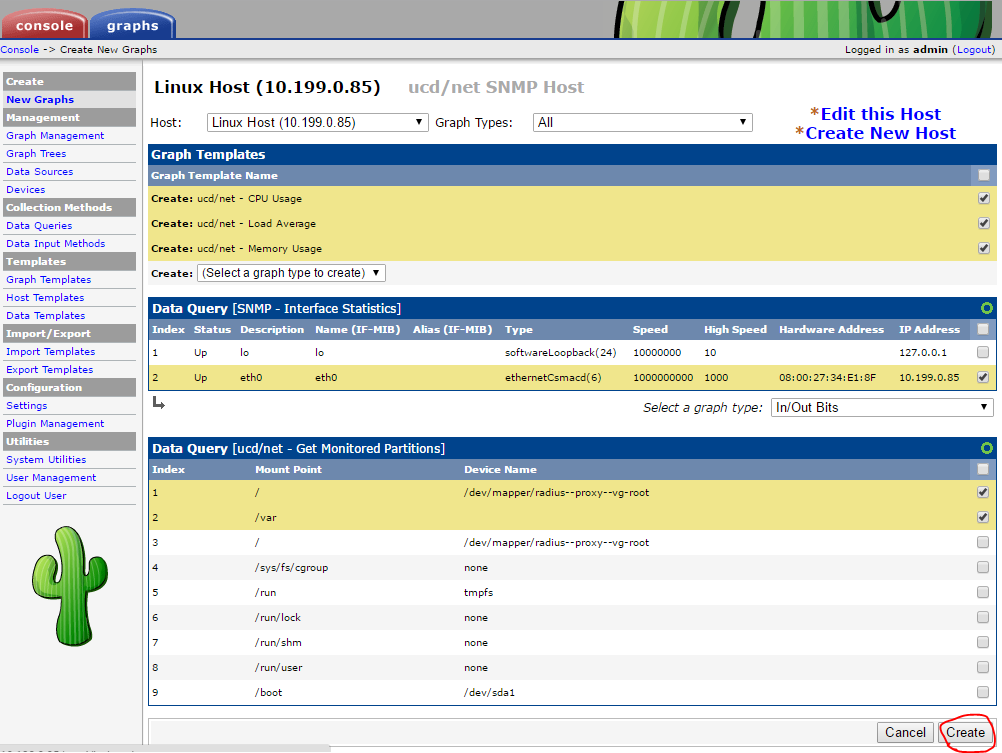
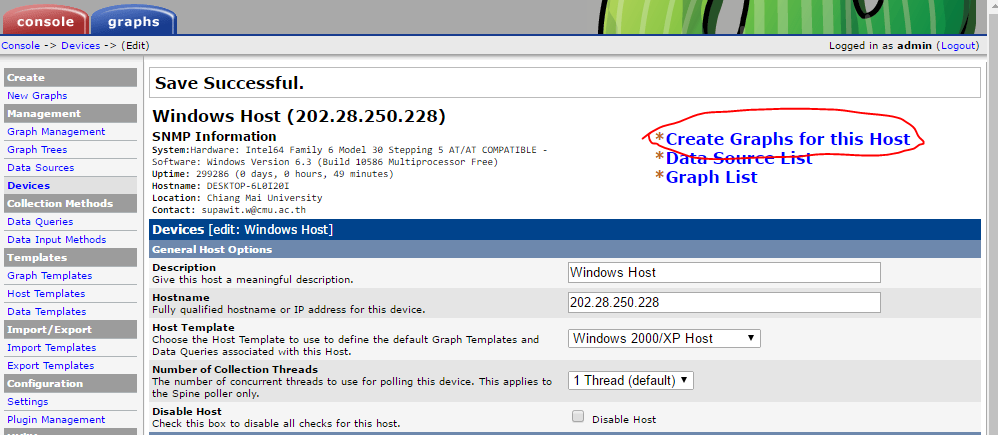
- คลิก Create Graphs for this host
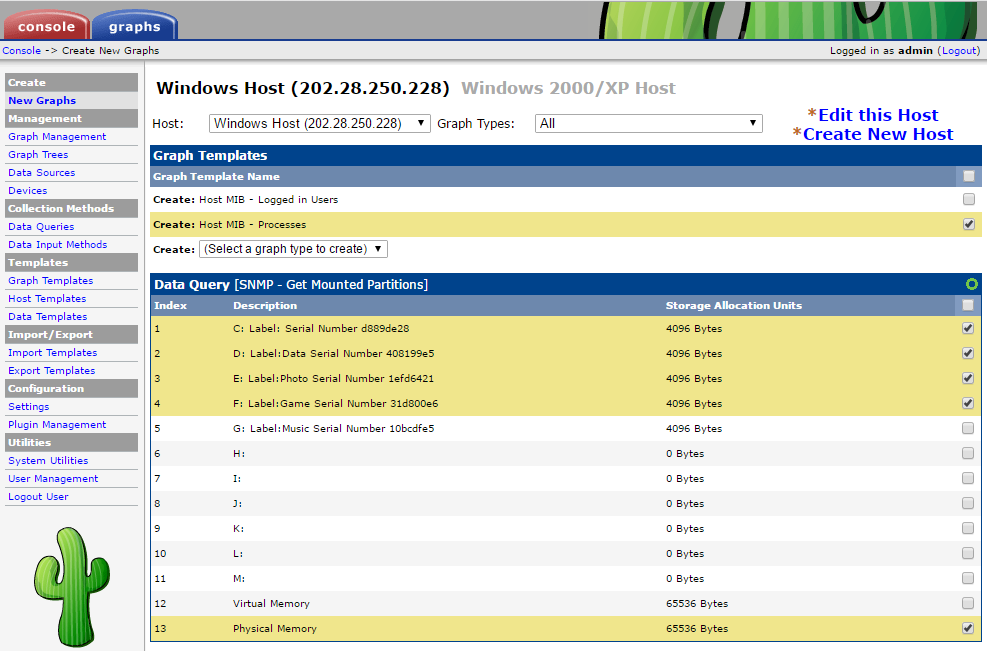
- เลือกสร้างกราฟที่ต้องการ
สร้าง graph tree
- คลิก Graph Trees แล้วคลิก Add
- ระบุรายละเอียด tree แล้วคลิก Create
เพิ่มอุปกรณ์ลงใน tree
- เลือกอุปกรณ์ที่จะเพิ่มลง tree แล้วเลือก Place on a Tree(ชื่อ tree) แล้วคลิก Go
- เลือกที่อยู่ใน tree แล้วคลิก Continue
ดูกราฟ
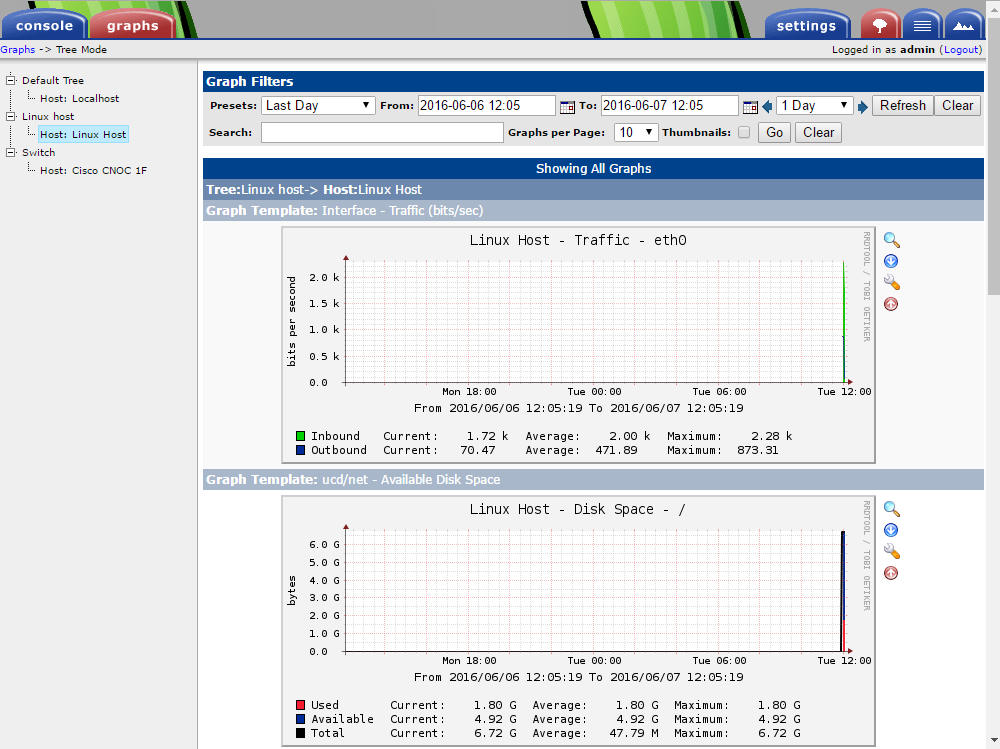
เพิ่มอุปกรณ์ประเภท Windows
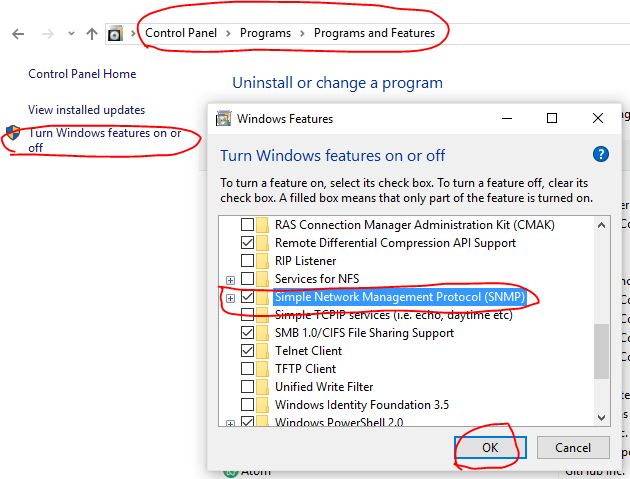
เปิด SNMP service บน Windows
- ยกตัวอย่าง Windows 10 ไปที่ Control Panel > Programs > Programs and Features > Turn Windows feature on or off แล้วเลือก SNMP
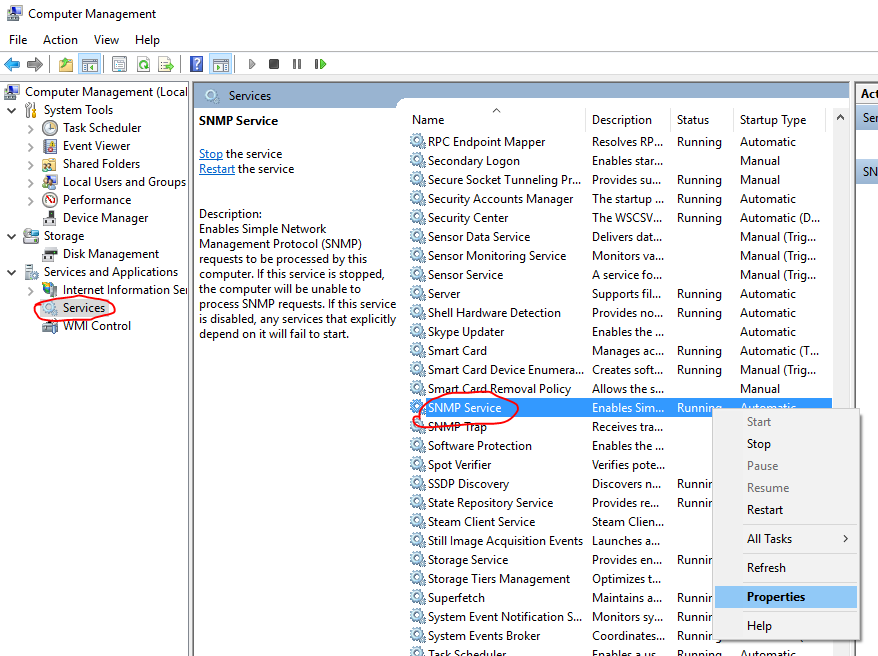
- เปิด Computer Management คลิกขวาที่ SNMP Service เลือก Properties
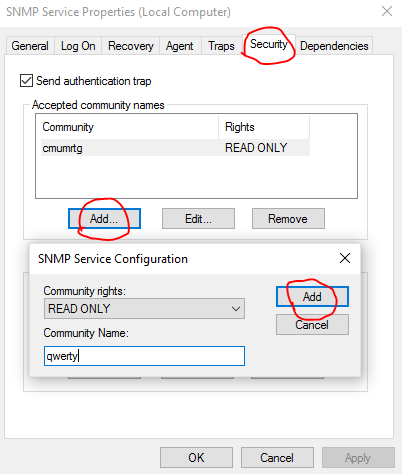
- ที่ tab Agent ระบุข้อมูล
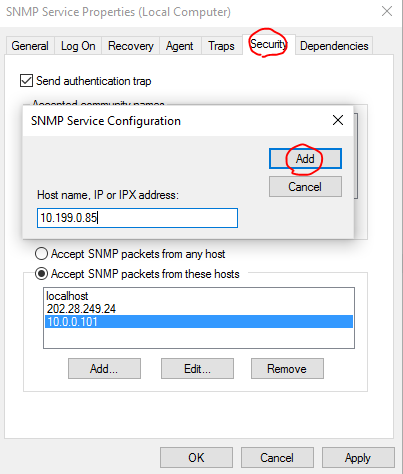
- ที่ tab Security ระบุ Community string และ ip address ของ NMS แล้ว restart Service SNMP
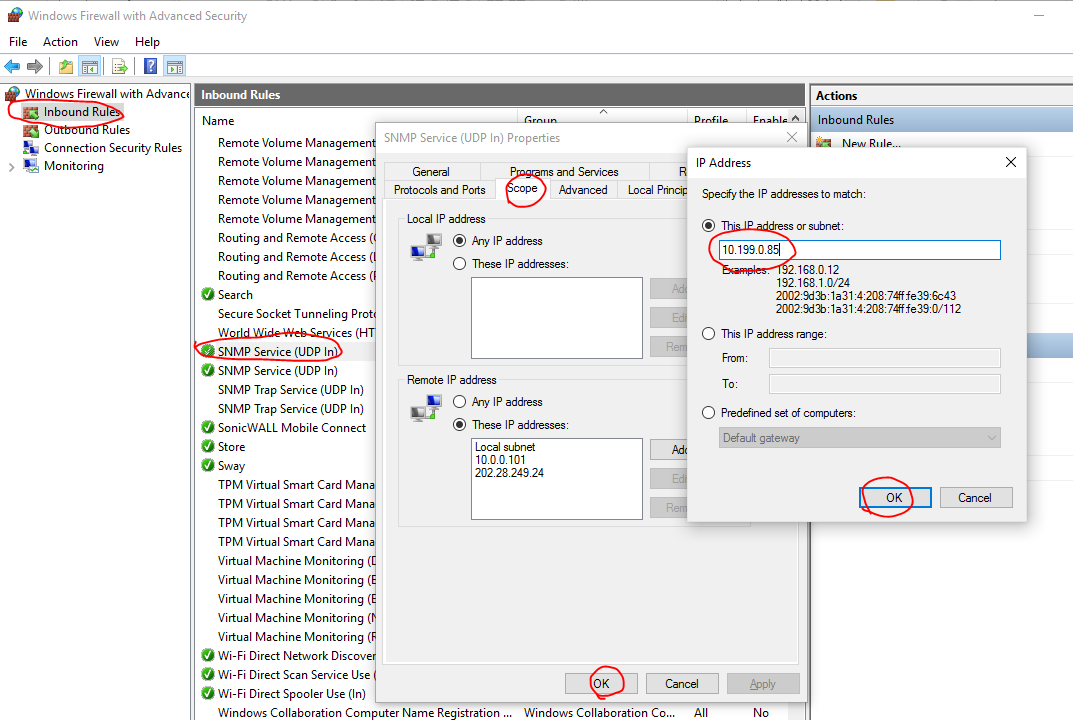
- เปิด Windows Firewall ให้ ip address ของ NMS เข้ามาดึงข้อมูลจาก SNMP service ได้
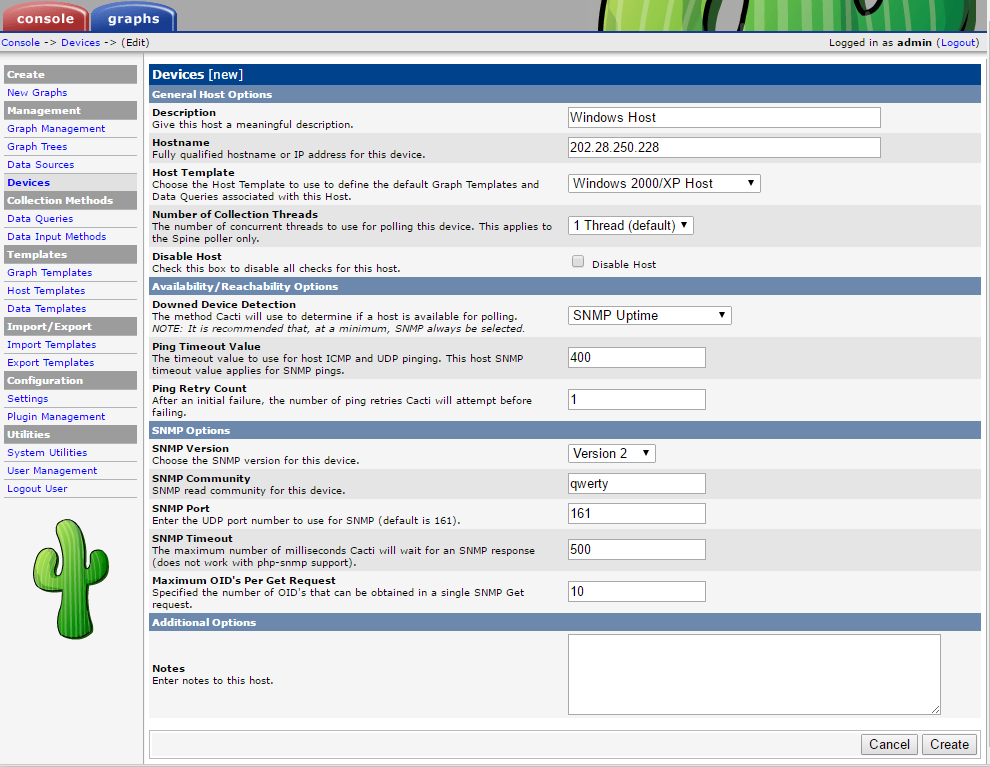
เพิ่มอุปกรณ์
- คลิก Add
- ระบุข้อมูล SNMP ของอุปกรณ์ปลายทาง
สร้างกราฟ
- คลิก Create Graphs for this host
- เลือกสร้างกราฟที่ต้องการ
สร้าง graph tree
- คลิก Graph Trees แล้วคลิก Add
- ระบุรายละเอียด tree แล้วคลิก Create
เพิ่มอุปกรณ์ลงใน tree
- เลือกอุปกรณ์ที่จะเพิ่มลง tree แล้วเลือก Place on a Tree(ชื่อ tree) แล้วคลิก Go
- เลือกที่อยู่ใน tree แล้วคลิก Continue
ดูกราฟ
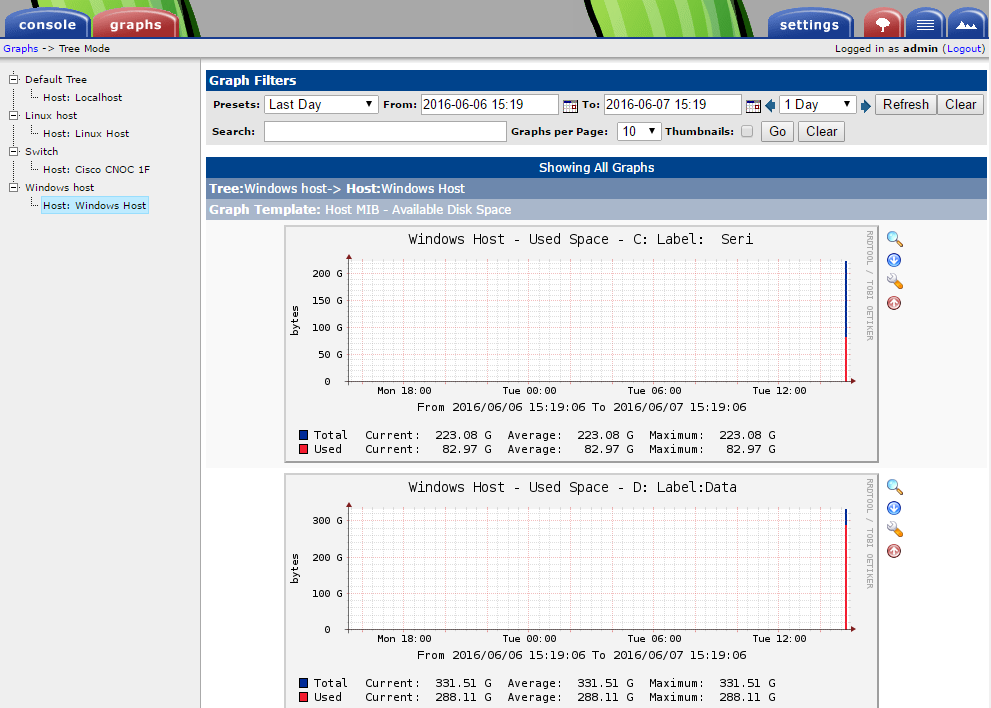
Custom data input and template
เนื่องจาก template ที่ให้มาไม่ครอบคลุม และมีอุปกรณ์เฉพาะที่ต้องการ monitor นอกจาก switch หรือ server เป็นจำนวนผู้ใช้งาน wireless เป็นต้น
สร้าง script สำหรับดึงข้อมูล
script จะเป็นภาษาอะไรก็ได้เช่น php , bash , python โดยใน script ใช้ library ของตนในการดึกข้อมูลจากอะไรก็ได้เช่น SNMP , ssh , REST API(HTTP) เป็นต้น
โดยที่ output จากการ run script บน linux shell จะต้องออกมาในรูปแบบที่ถูกต้องคือ
fieldName1:value1 fieldName2:value2 fieldName3:value3 ...
โดยจะมีข้อมูลกี่ field ก็ได้คั่นด้วยช่องว่าง จำนวน field ของ script output จะมีผลต่อการการสร้าง template ในการเก็บข้อมูลของ cacti
ตัวอย่าง script ดึงข้อมูลจำนวนผู้ใช้งาน wireless จาก cisco controller แยกตาม ssid
<?php
$controller = $argv[1];
$community_string = $argv[2];

$snmp = snmp2_walk($controller,$community_string,'1.3.6.1.4.1.14179.2.1.4.1.7'); // bsnMobileStationSsid
$result = array_count_values($snmp);

$JumboPlus              = isset($result['STRING: @JumboPlus'])?$result['STRING: @JumboPlus']:0;
$TOTWiFi                = isset($result['STRING: @TOT_Wi-Fi'])?$result['STRING: @TOT_Wi-Fi']:0;
$AISWiFi                = isset($result['STRING: @ AISwifi'])?$result['STRING: @ AISwifi']:0;
$TRUEWiFi               = isset($result['STRING: .@  TRUEWIFI'])?$result['STRING: .@  TRUEWIFI']:0;
$eduroam                = isset($result['STRING: eduroam'])?$result['STRING: eduroam']:0;

echo trim("jumboplus:$JumboPlus tot:$TOTWiFi ais:$AISWiFi true:$TRUEWiFi eduroam:$eduroam");
?>
run script บน shell จะได้ output
supawit@cacti:/usr/share/cacti/site/scripts$ php cisco_user_count_per_ssid_poller_tot.php [controller ip address] [community string]
jumboplus:8954 tot:101 ais:1250 true:269 eduroam:22supawit@cacti:/usr/share/cacti/site/scripts$
สร้าง script ดึงข้อมูล CPU Load ของ windows
สร้างไฟล์ /usr/share/cacti/site/scripts/winCpuLoad.php
<?php
$host = $argv[1];
$community = $argv[2];

$result = snmpwalk($host,$community,'hrProcessorLoad');
$result = str_replace('INTEGER: ',"",$result);

$output = "";
foreach($result  as $index => $value)
{
        $output .= "cpu$index:$value ";
}
echo trim($output);
?>
run script บน shell
root@ubuntu:~# cd /usr/share/cacti/site/scripts/
root@ubuntu:/usr/share/cacti/site/scripts# php winCpuLoad.php [ip] [community string]
cpu0:5 cpu1:5 cpu2:7 cpu3:6root@ubuntu:/usr/share/cacti/site/scripts#
สร้าง Data Input Method
ต้องสร้างให้สอดคล้องกับ script ที่สร้างไว้ในที่นี่คือ cpu 4 core
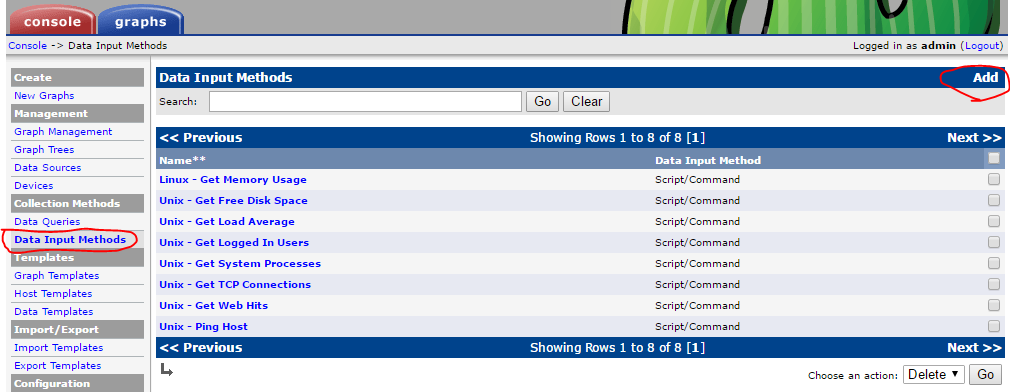
- ที่เมนู Data Input Method คลิก Add
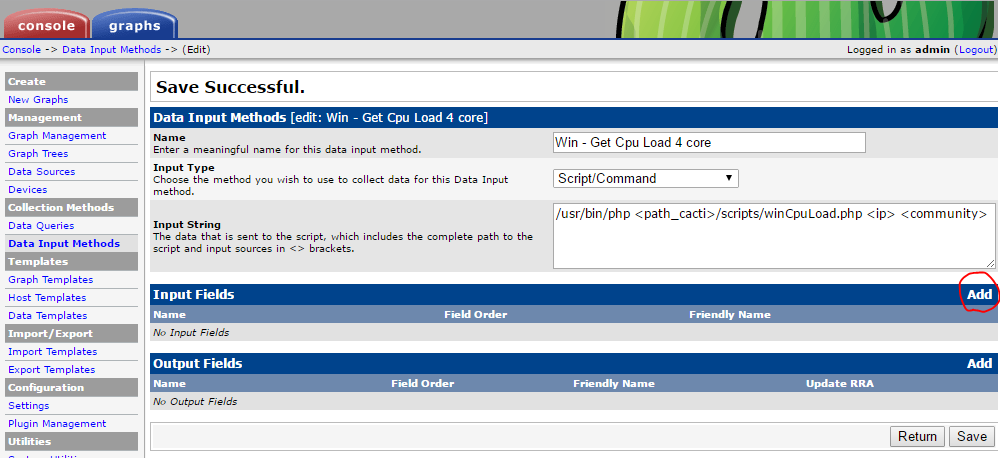
- ระบุรายละเอียดของ Data Input Method โดยค่าที่ที่อยู่ใน <> เป็นตัวแปร
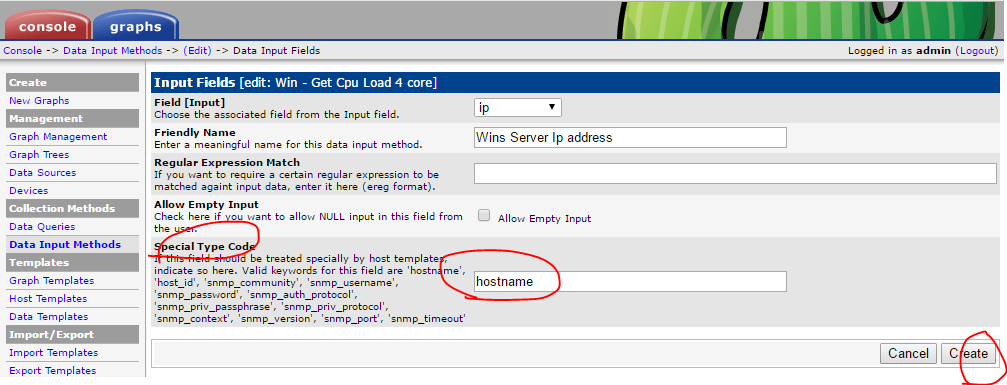
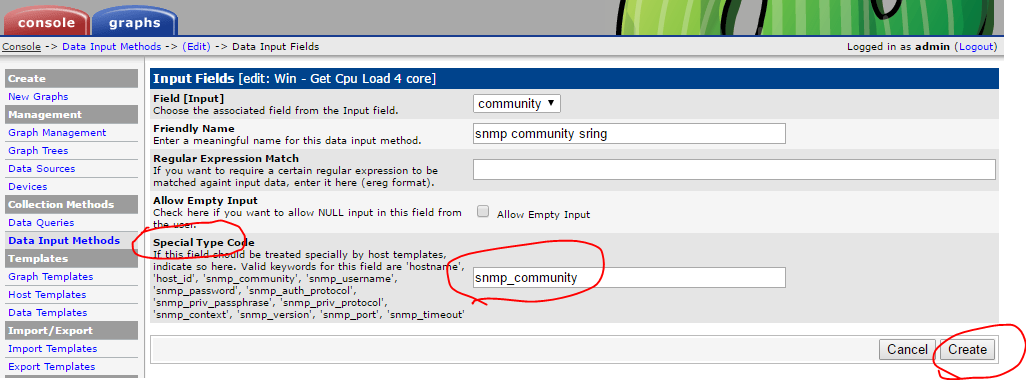
- เพิ่ม Input Field ให้สอดคล้องกับ script
เลือกตัวแปร Input โดยใช้ Special Type Code คือรับจากจาก device ที่ตั้งไว้ - เพิ่ม Output Field ให้สอดคล้องกับ script
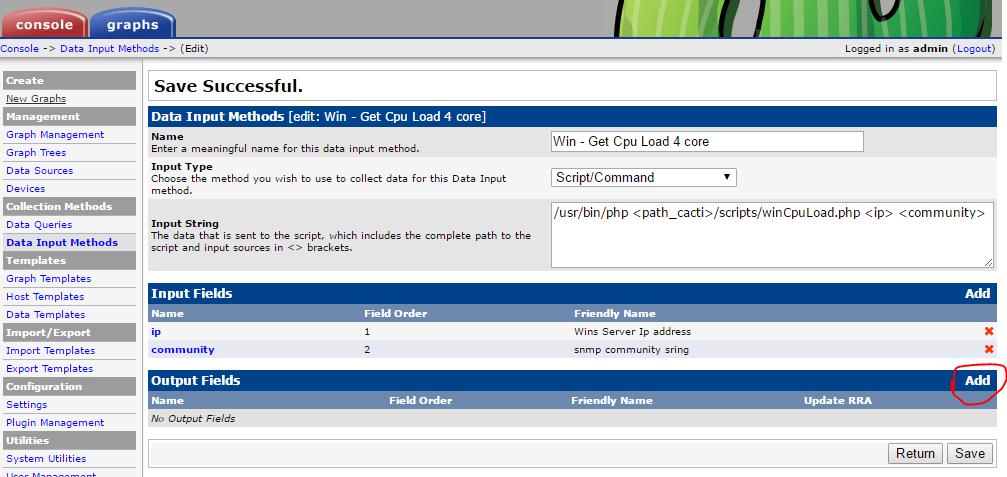
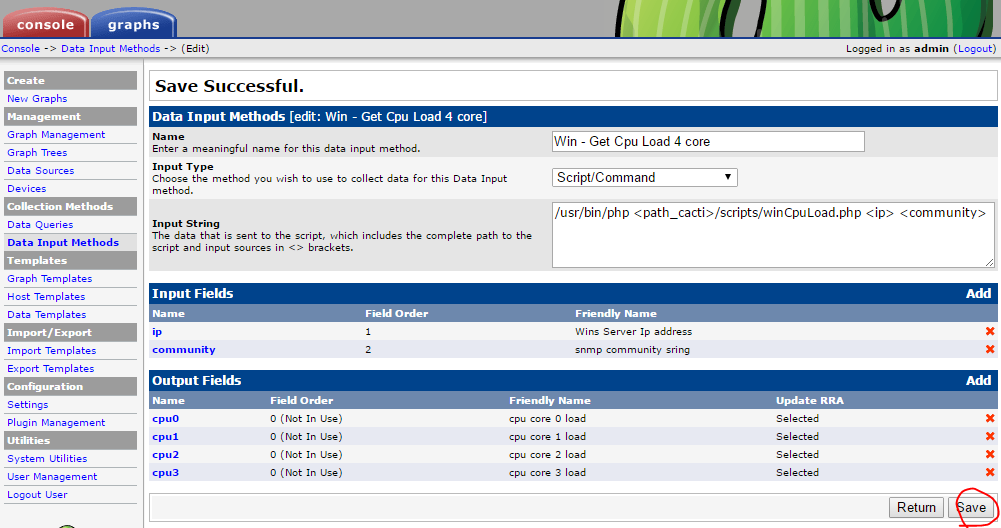
โดยชื่อของ Field [Output] จะต้องตรงกับชื่อ field ของ script
ในที่นี้ script output เป็นcpu0:5 cpu1:5 cpu2:7 cpu3:6ให้สร้าง Output Field จนครบ
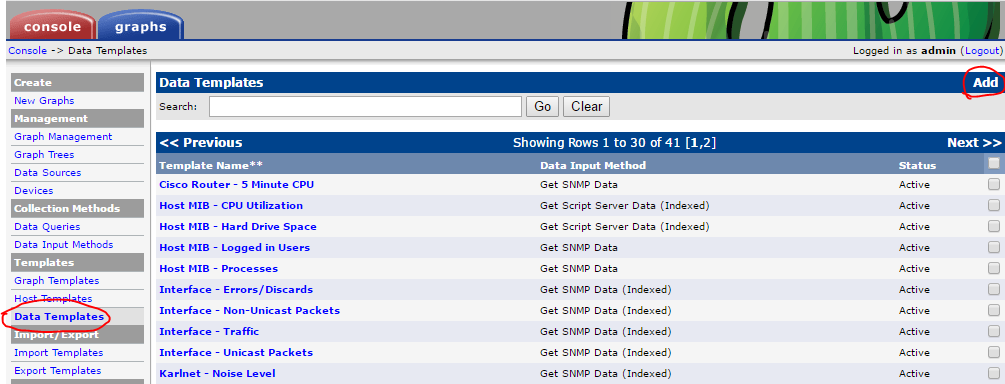
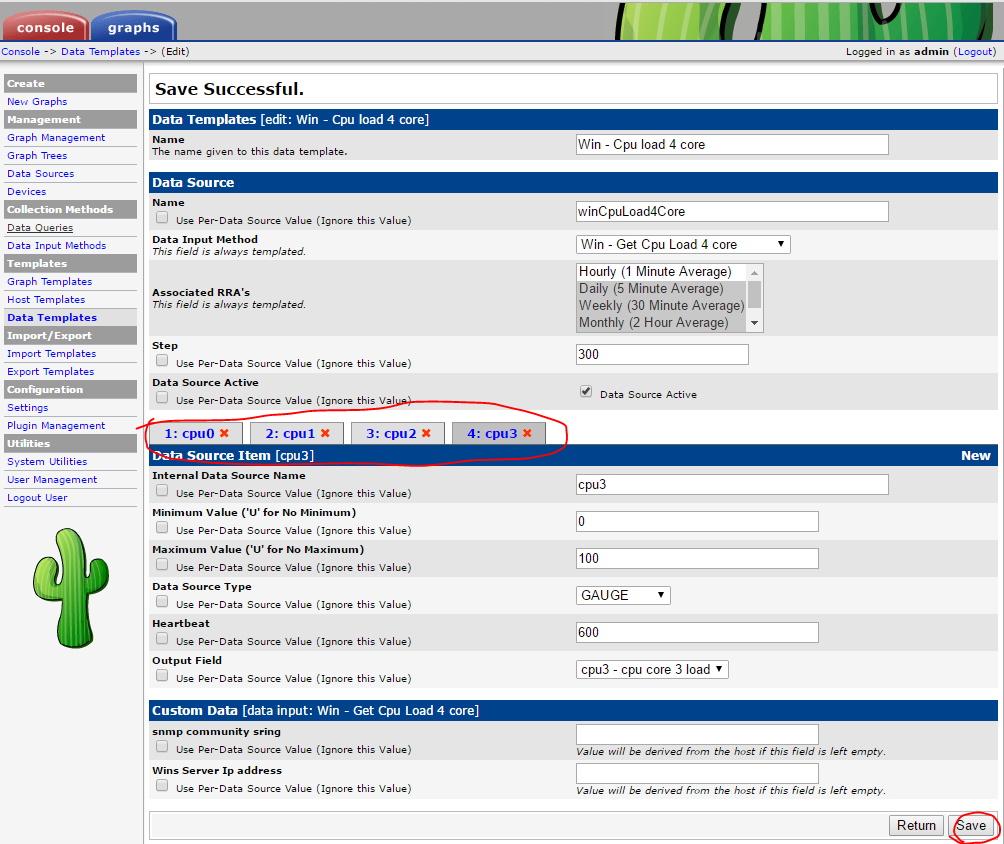
สร้าง Data Template
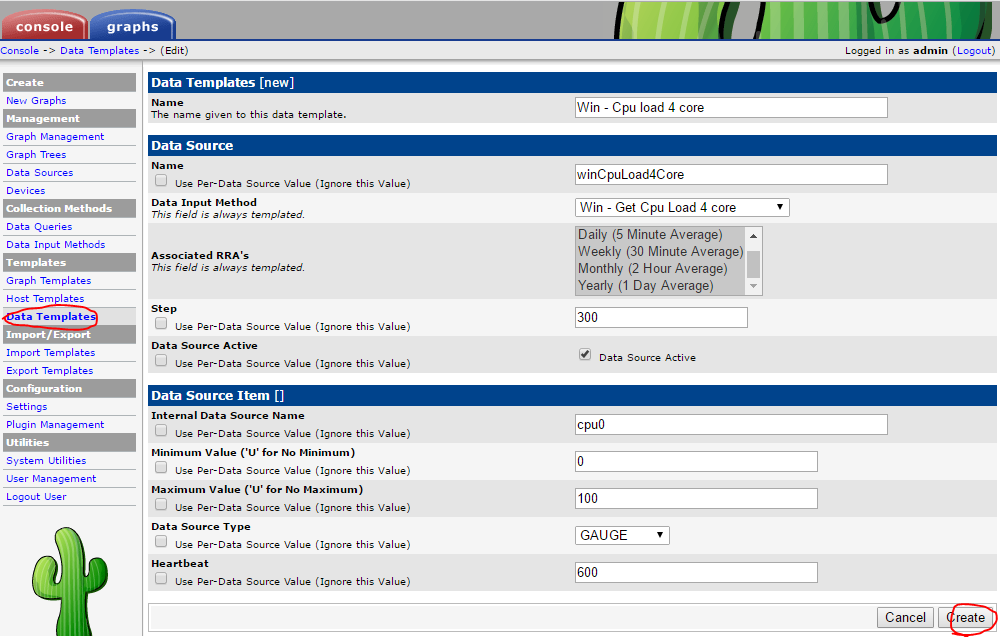
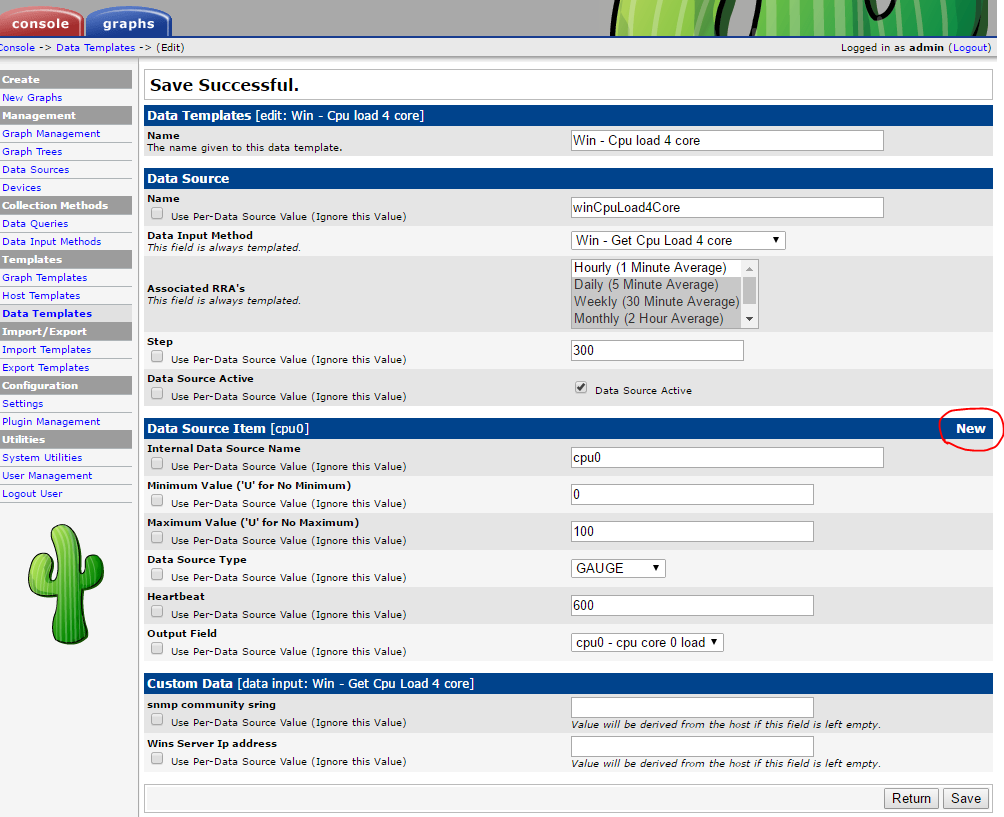
คือการกำหนดคุณลักษณะของไฟล์ rrdtool ที่จะใช้เก็บข้อมูลจาก Data Input Method ซึ่งต้องทำให้สอดคล้องกัน
- ที่เมนู Data Templates คลิก Add
- ระบุรายละเอียดของ Data Templates
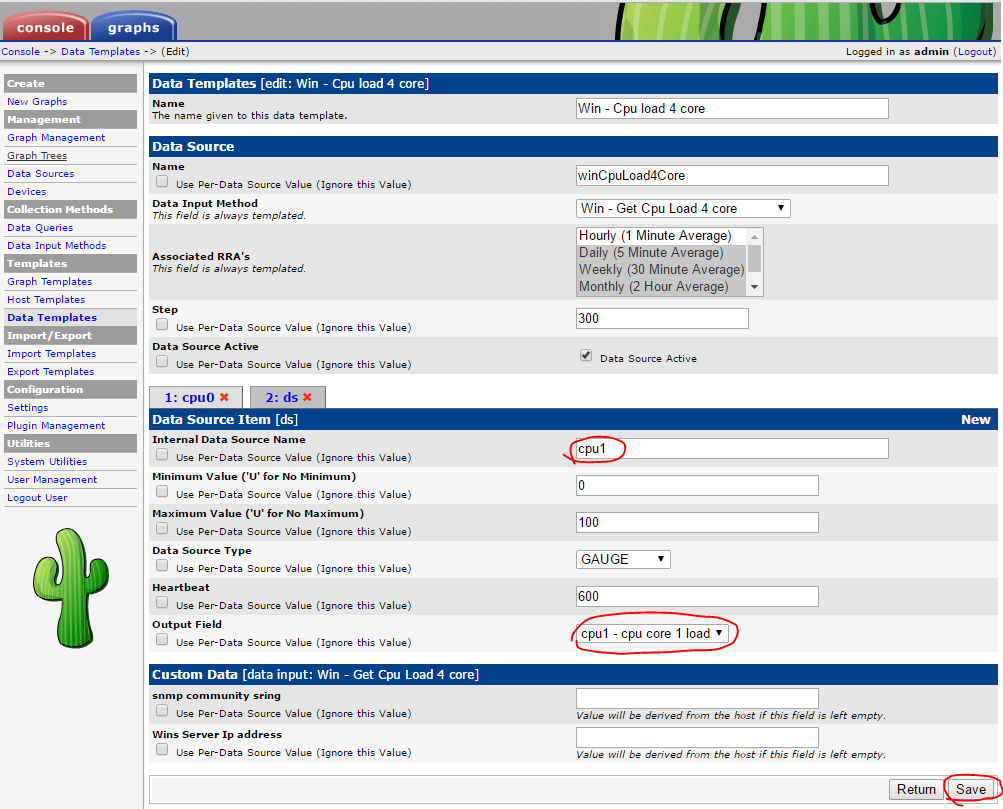
- เพิ่ม Data Source ให้สอดคล้องกับ Output Field ของ script
- เพิ่ม Data Source ให้ครบทุก Output Field ของ Data Input Method
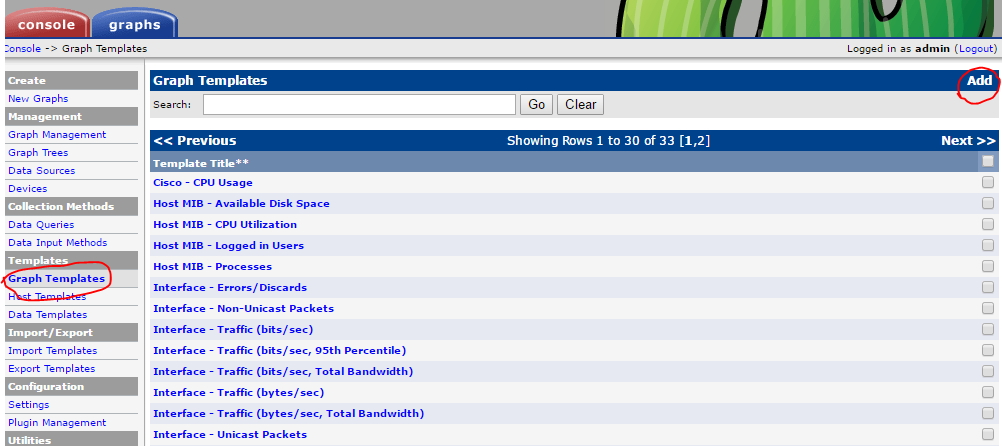
สร้าง Graph Template
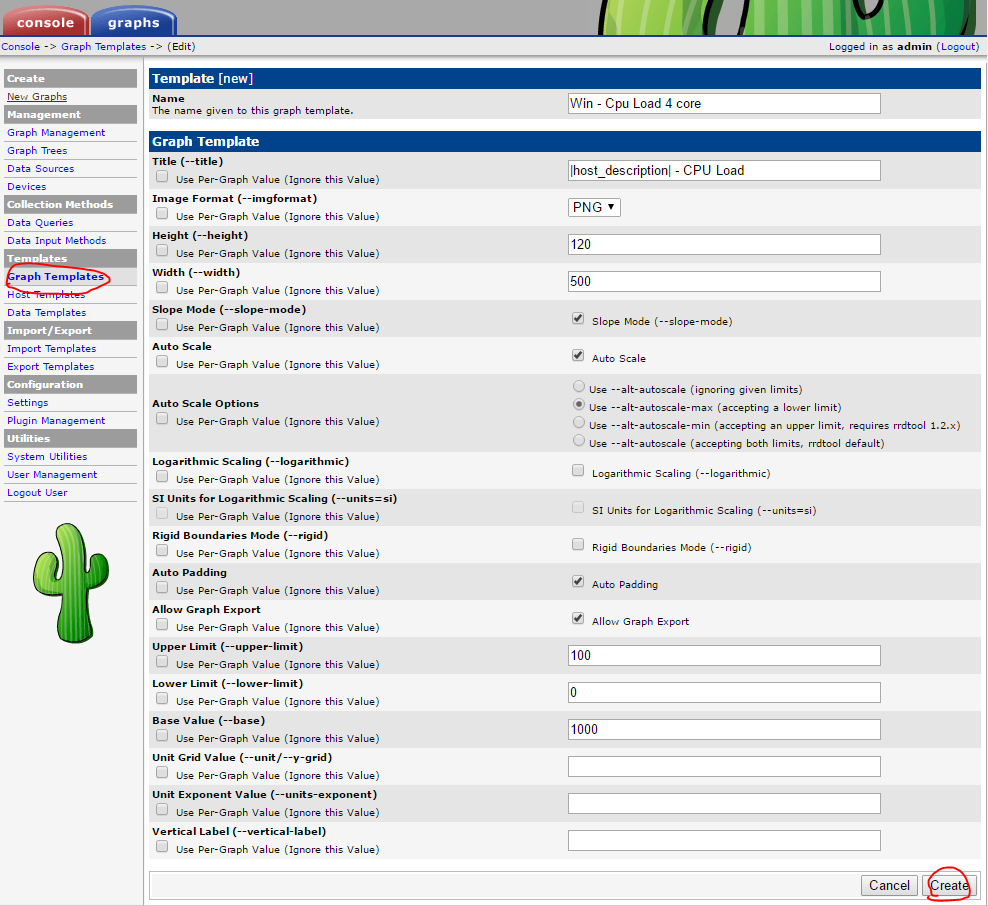
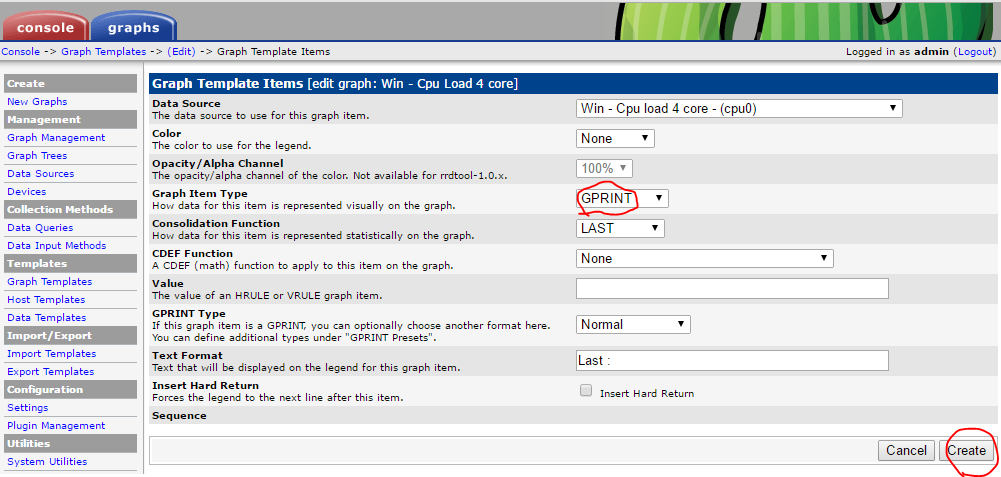
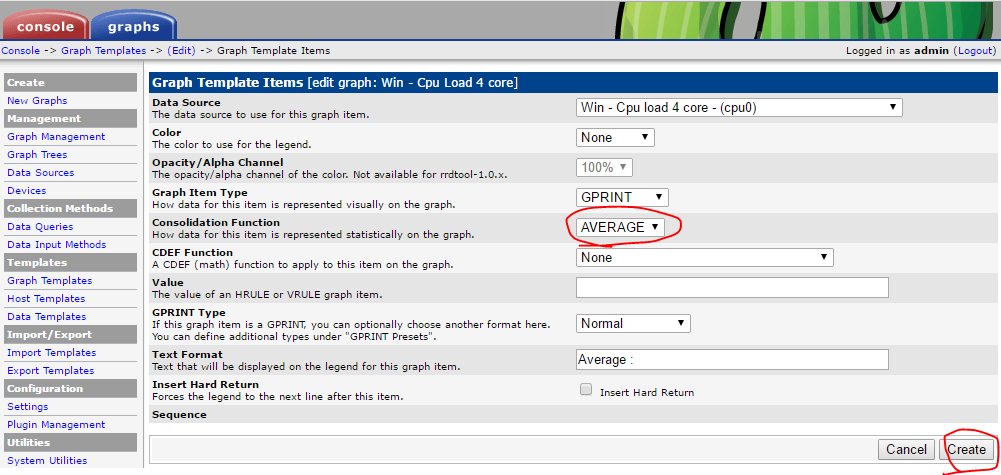
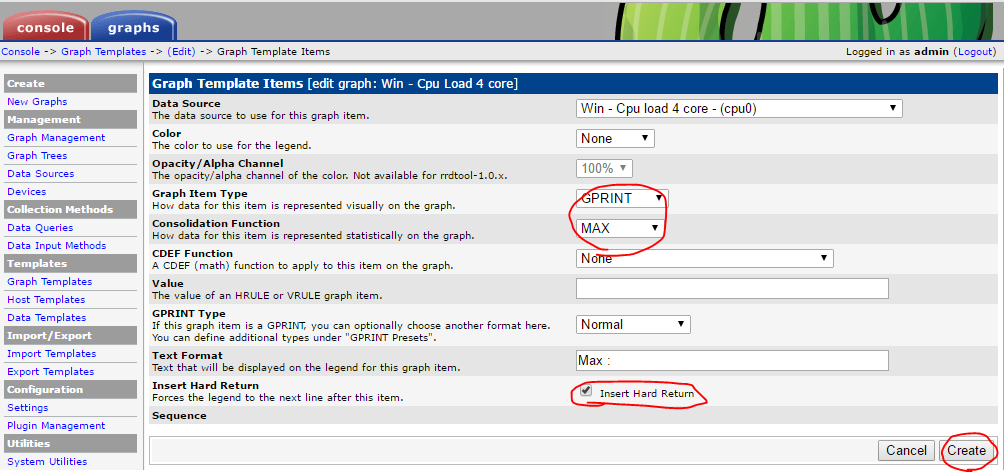
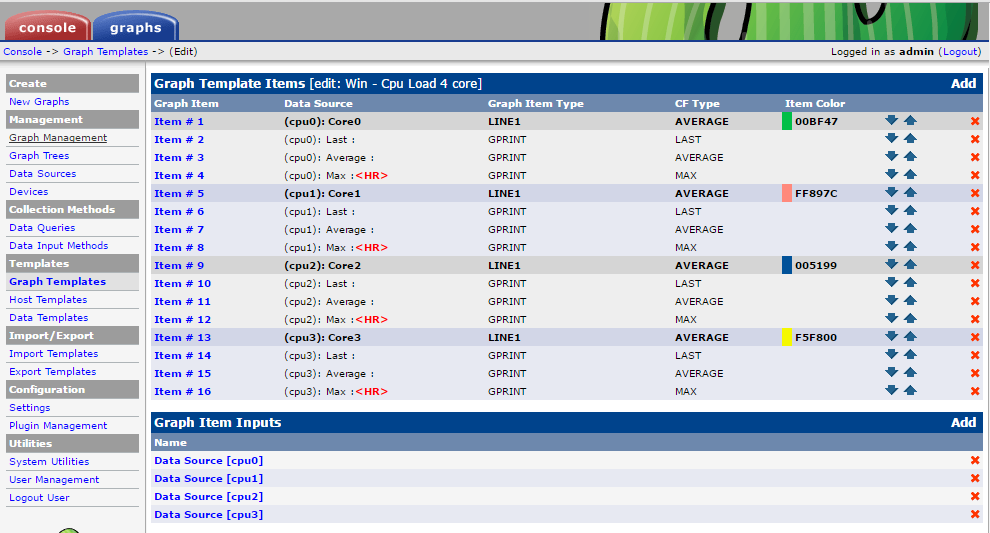
คือการกำหนดคุณลักษณะของกราฟที่จะแสดงเช่นชื่อหัวข้อ สี ลักษณะของกราฟว่าเป็นกราฟเส้นหรือพื้นที่หรือซ้อนต่อกันรวมถึงข้อความต่าง ๆ บนกราฟ
- ที่เมนู Graph Templates กด Add
- ระบุรายละเอียดต่าง ๆ ของกราฟ
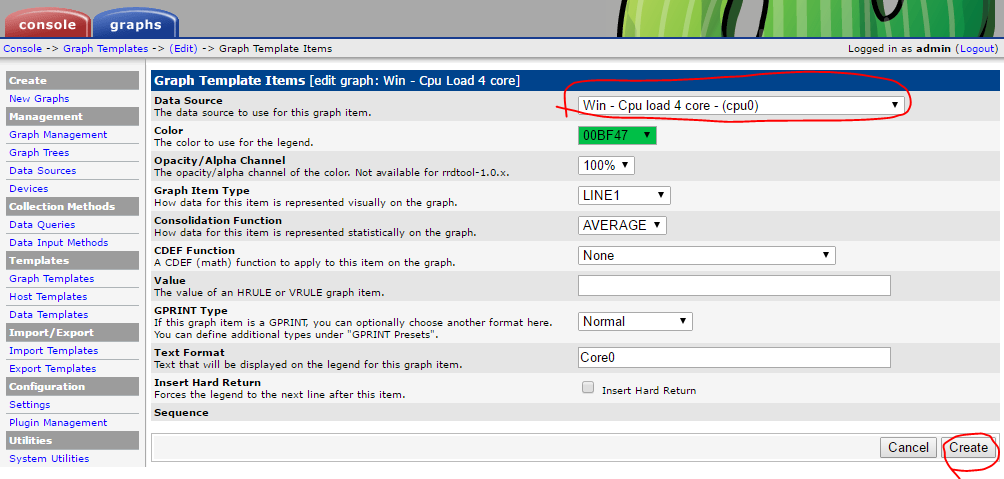
- เพิ่มข้อมูลเข้าไปในกราฟ
- เลือก Data source และชนิดของกราฟว่าจะเป็นกราฟเส้นกราฟพื้นที่หรือกราฟแบบซ้อน
- เพิ่ม Graph Item ชนิด GPRINT เพิ่มแสดงข้อความบนกราฟ โดยแสดงค่าล่าสุด
- เพิ่ม Graph Item ชนิด GPRINT เพิ่มแสดงข้อความบนกราฟ โดยแสดงค่าเฉลี่ย
- เพิ่ม Graph Item ชนิด GPRINT เพิ่มแสดงข้อความบนกราฟ โดยแสดงค่าสูงสุด เลือก Insert Hard Return เพื่อขึ้นบรรทัดใหม่
- เลือก Data source และชนิดของกราฟว่าจะเป็นกราฟเส้นกราฟพื้นที่หรือกราฟแบบซ้อน
- เพิ่ม Graph Item อันที่เหลือให้ครบทุก Data Source
สร้างกราฟ
- ที่เมนู Device เลือก Host Windows ที่สร้างไว้ ในส่วน Associated Graph Templates -> Add Graph Template เลือก Win - Cpu Load 4 Core ที่สร้างไว้ แล้ว Add
- คลิกที่ Create Graphs for this Host
- เลือก Graph Template Win - Cpu Load 4 core ที่สร้างไว้ แลเว Create
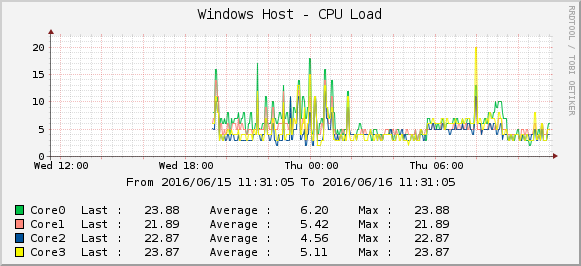
- ที่ Graph ของ Device จะเห็นกราฟเพิ่มขึ้นมา
การแก้ไขปัญหา
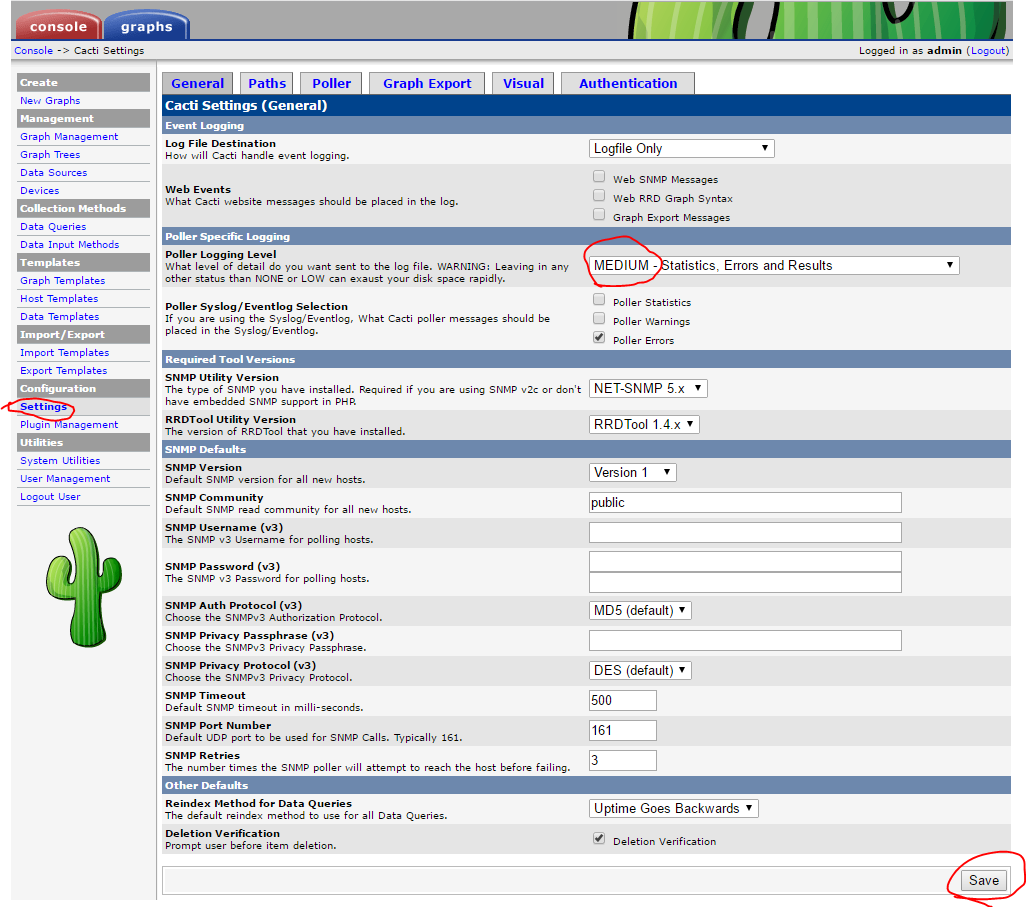
- ไปที่เมนู Settings ที่ tab General ในส่วนของ Poller Logging Level เลือกเป็น MEDIUM
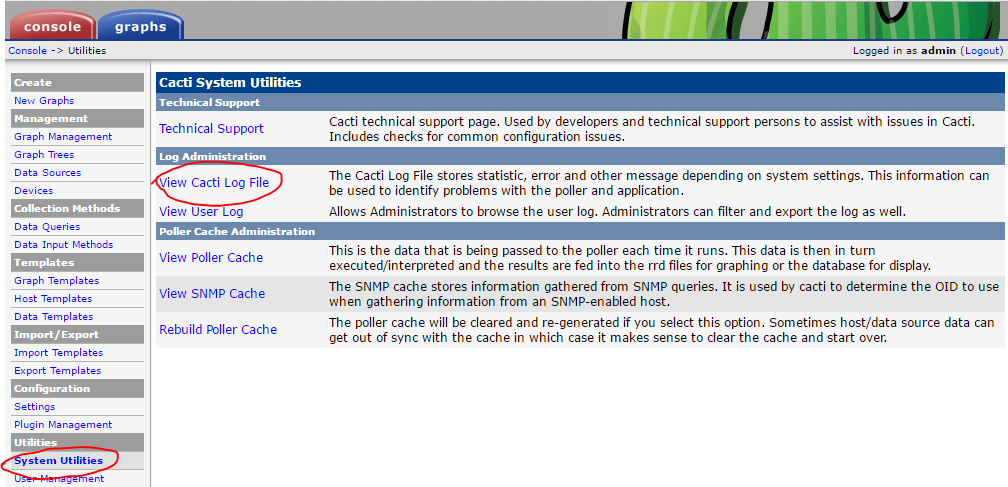
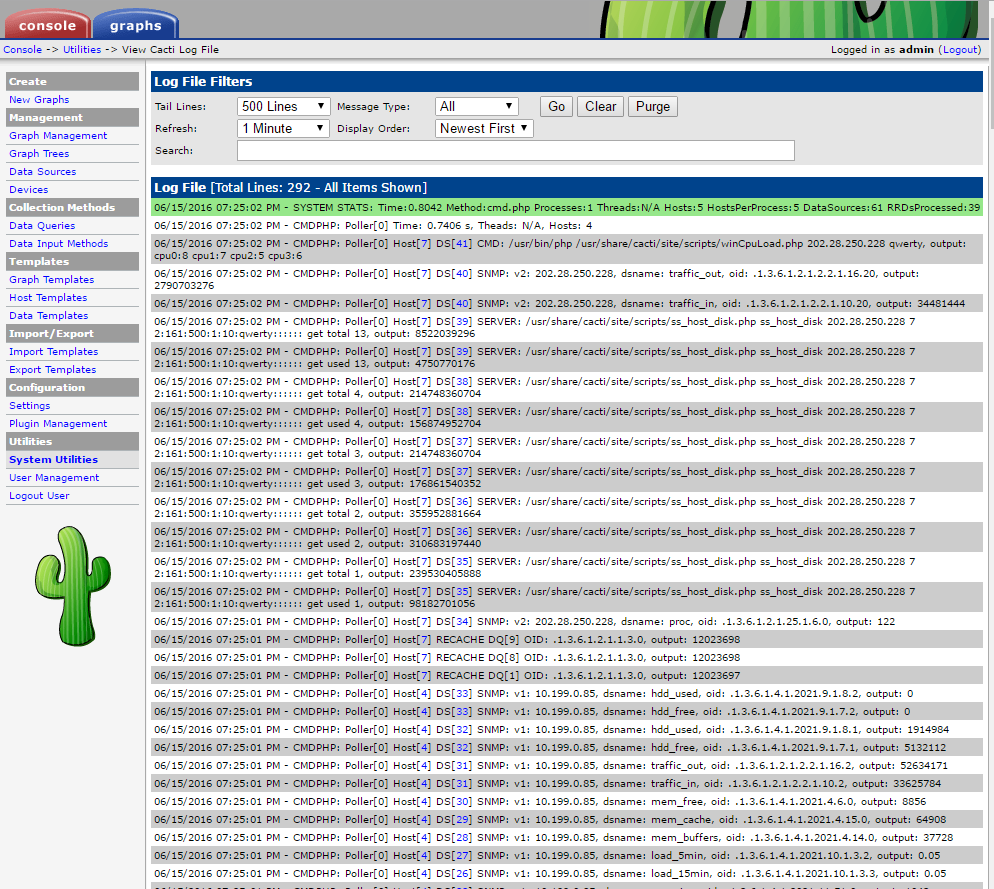
- ไปที่เมนู System Utilities เลือก View Cacti Log File จะมีรายละเอียดอยู่
- การปรับ Logging Level เป็น MEDUIM หรือสูงกว่าควรปรับเฉพาะต้องการแก้ไขปัญหา หลังจากแก้ไขเสร็จควรปรับเป็น LOW เนื้่องจากถ้ามีอุปกรณ์จำนวนมาก Log File จะใหญ่เกินไป
rrdtool
rrdtool เป็นฐานข้อมูลแบบไฟล์ที่เก็บข้อมูลว่าในเวลาไหนข้อมูลมี่ค่าอะไร โดยจะต้องระบุระยะเวลาที่จะเก็บค่าต่าง ๆ ไว้ตั้งแต่ตอนสร้างฐานข้อมูลทำให้ให้มีโครงสร้างที่แน่นอนเพื่อให้เขียนอ่านข้อมูลได้รวดเร็ว
การสร้างไฟล์ rrdtool
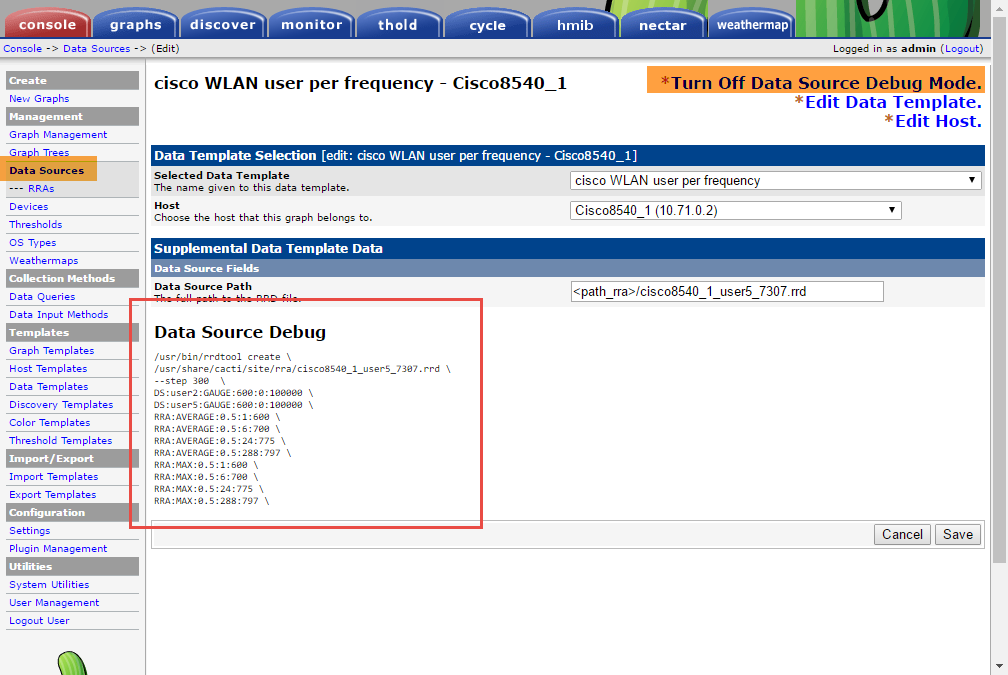
จากรูปเมื่อเปิด debug ดูไฟล์ rrdtool จะเห็นคำสั่งการสร้าง rrdtool โดยรูปแบบคือ
/usr/bin/rrdtool create [path ของ file rrdtool]
--step 300 คือช่วงเวลาที่จะเก็บข้อมูล 300 คือ ทุก 5 นาที
ในส่วนของการประกาศ data source(ในนึกถึง field ในฐานข้อมูลทั่วไป)
DS:[ชื่อของ data source]:[ชนิดของ data source]:[heartbeat]:[min]:[max]
ชนิดของ data source โดยทั่วไปจะใช้อยู่สองชนิดคือ GAUGE และ COUNTER
GAUGE คือค่าทั่วไป
COUNTER คือค่าที่เพิ่มขึ้นเรื่อย ๆ โดย rrdtools จะคำนวนเองเมื่อมีการ overflow เกิดขึ้น
heartbeat คือจำนวนวินาทีสูงสุดที่รับได้ระหว่างการอัพเดทค่าสองครั้งถ้าเกินค่าจะเป็น unknown
ในส่วนของการประกาศ round robin archive (RRA) คือการระบุว่าจะเก็บข้อมูลแบบไหนด้วยความถี่แบบไหนจำนวนเท่าไหร่
มีรูปแบบคือ RRA:{AVERAGE | MIN | MAX | LAST}:xff:steps:rows
เช่น
RRA:AVERAGE:0.5:1:600 คือเก็บค่าเฉลี่ย 1 step ไว้ 600 แถว ในที่นี้ step คือ 5 นาที คือเก็บข้อมูลทุก 5 นาทีไว้เป็นเวลา 2 วัน
RRA:AVERAGE:0.5:6:700 คือเก็บค่าเฉลี่ย 6 step ไว้ 700 แถว ในที่นี้ step คือ 5 นาที คือเก็บข้อมูลเฉลี่ยทุก 30 นาทีไว้เป็นเวลา 14 วัน
RRA:AVERAGE:0.5:24:775 คือเก็บค่าเฉลี่ย 24 step ไว้ 775 แถว ในที่นี้ step คือ 5 นาที คือเก็บข้อมูลเฉลี่ยทุก 2 ชั่วโมงไว้เป็นเวลา 2 เดือน
RRA:AVERAGE:0.5:288:797 คือเก็บค่าเฉลี่ย 288 step ไว้ 797 แถว ในที่นี้ step คือ 5 นาที คือเก็บข้อมูลเฉลี่ยทุก 1 วันไว้เป็นเวลา 797 วัน
ส่วน RRA ชนิด MAX ก็เก็บในลักษณธเดียวกันแต่เก็บค่าสูงสุด
การ update ค่าในไฟล์ rrdtool
ใช้คำสั่ง rrdtool update เช่น
rrdtool update /path/to/file.rrd -t ds1:ds2:ds3 N:4.5:U:9
-t คือ template ชื่อ data source ที่จะทำการเพิ่มค่าตามลำดับ
N คือเวลาปัจจุบันสามารถใส่เป็นค่า unix time stamp ได้และตามด้วยค่าที่จะเพิ่มใน data source ตามลำดับ
จากตัวอย่างคือ เพิ่มค่า 4.5 ให้ data source ds1 ค่า unknown ให้ ds2 และ 9 ให้ ds3 ตามลำดับ โดยค่าฟิลด์เวลาเป็นเวลาปัจจุบัน
เช่นถ้ารันคำสั่ง
rrdtool update /path/to/file.rrd -t ds1:ds2:ds3 N:4.5:U:9
rrdtool update /path/to/file.rrd -t ds1:ds2:ds3 N+300:7:6:5.7
rrdtool update /path/to/file.rrd -t ds1:ds2:ds3 N+600:2.1:9:U
ค่าใน rrdtool file ก็จะมีลักษณะเป็น
|time |ds1|ds2|ds3|
-------------------
|N    |4.5|U  |9  |
|N+300|7  |6  |5.7|
|N+600|2.1|9  |U  |
การสร้างกราฟจากไฟล์ rrdtool
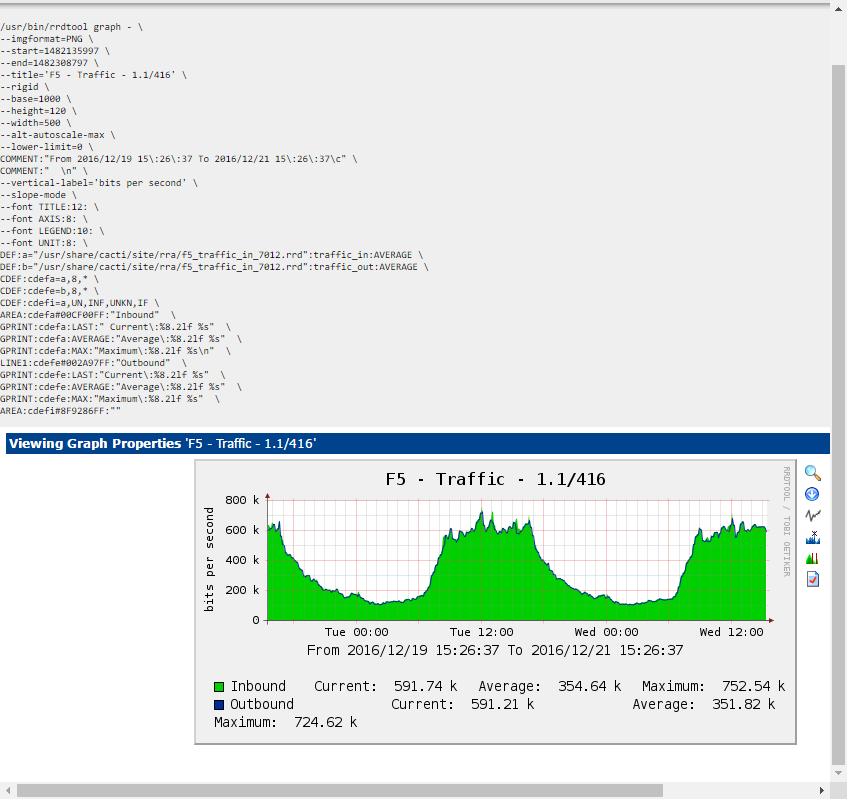
ใช้คำสั่ง rrdtool graph
จะมีสามส่วนหลัก
1. ส่วนกำหนดลักษณะของกราฟเช่นชนิดของรูป ช่วงเวลาของข้อมูล ขนาดของรูปภาพ หัวข้อ คำอธิบายต่าง ๆ
2. ส่วนประกาศข้อมูลโดยใช้ DEF เพื่อประกาศข้อมูลโดยอ้างอิง path ของไฟล์ rrd ชื่อ data source และ rra ที่เก็บข้อมูล
รวมถึงการนำ DEF ที่ประกาศมาเข้า function เพื่อนำไปแปลงค่าก่อนโดยใช้ CDEF ซึ่งเขียนด้วยภาษา RPN(Reverse Polish Notation) สามารถศึกษารายละเอียดได้ที่ cdeftutorial จากตัวอย่าง CDEF ชื่อ cdefa มีค่าเท่ากับ DEF a x 8 เป็นต้น
3. ส่วนการนำข้อมูลมาพลอตกราฟโดยกำหนดคุณลักษณะไปด้วยว่าจะพลอตกราฟแบบไหน เช่น AREA กราฟทึบ, LINE กราฟเส้น, GPRINT กำหนดค่าสิ ตัวเลขจากข้อมูลที่จะเขียนลงในกราฟเป็นต้น ส่วนประกอบที่ประกาศจะถูกเขียนลงในกราฟตามลำดับ จากตัวอย่างนำเอา cdefa มาพลอดกราฟพื้นที่สี 00CF00 โดยใช้ชื่อว่า Inbound, นำเอา cdefe มาพลอตกราฟเส้นขนาด 1 ใช้ชื่อว่า Outbound สามารถศึกษารายละเอียดได้ที่ rrdgraph_graph
การดึงข้อมูลจาก rrdtool
สามารถดึงข้อมูลจาก rrdtool file ออกมาแบบเป็นข้อความเพื่อนำไปใช้ประโยชน์อื่น ๆ โดยใช้คำสั่ง rrdtool graphv เช่น
rrdtool graphv - \
--start -1d \
--end now \
DEF:in=e-learning_traffic_in_175.rrd:traffic_in:AVERAGE \
DEF:out=e-learning_traffic_in_175.rrd:traffic_out:AVERAGE \
CDEF:inb=in,8,* \
CDEF:outb=out,8,* \
PRINT:inb:AVERAGE:"Last day average inbound traffic \: %4.2lf %s" \
PRINT:inb:MAX:"Last day max inbound traffic \: %4.2lf %s" \
PRINT:outb:AVERAGE:"Last day average outbound traffic \: %4.2lf %s" \
PRINT:outb:MAX:"Last day average outbound traffic \: %4.2lf %s" \
จะได้ผลลัพธ์เป็น
print[0] = "Last day average inbound traffic : 1.17 M"
print[1] = "Last day max inbound traffic : 11.78 M"
print[2] = "Last day average outbound traffic : 42.38 k"
print[3] = "Last day average outbound traffic : 370.78 k"
คำสั่งอื่น ๆ ของ rrdtool
rrdtool info [path/to/file.rrd] แสดงข้อมูลของไฟล์ rrdtool
rrdtool info cmu_mis_1_traffic_in_220.rrd
filename = "cmu_mis_1_traffic_in_220.rrd"
rrd_version = "0003"
step = 300
last_update = 1483936215
header_size = 2912
ds[traffic_in].index = 0
ds[traffic_in].type = "COUNTER"
ds[traffic_in].minimal_heartbeat = 600
ds[traffic_in].min = 0.0000000000e+00
ds[traffic_in].max = 1.0000000000e+08
ds[traffic_in].last_ds = "1121540562"
ds[traffic_in].value = 2.2166490048e+07
ds[traffic_in].unknown_sec = 0
ds[traffic_out].index = 1
ds[traffic_out].type = "COUNTER"
ds[traffic_out].minimal_heartbeat = 600
ds[traffic_out].min = 0.0000000000e+00
ds[traffic_out].max = 1.0000000000e+08
ds[traffic_out].last_ds = "2497746928"
ds[traffic_out].value = 4.9326521129e+06
ds[traffic_out].unknown_sec = 0
rra[0].cf = "AVERAGE"
rra[0].rows = 600
rra[0].cur_row = 431
rra[0].pdp_per_row = 1
rra[0].xff = 5.0000000000e-01
rra[0].cdp_prep[0].value = NaN
rra[0].cdp_prep[0].unknown_datapoints = 0
rra[0].cdp_prep[1].value = NaN
rra[0].cdp_prep[1].unknown_datapoints = 0
rra[1].cf = "AVERAGE"
rra[1].rows = 700
rra[1].cur_row = 261
rra[1].pdp_per_row = 6
rra[1].xff = 5.0000000000e-01
rra[1].cdp_prep[0].value = 0.0000000000e+00
rra[1].cdp_prep[0].unknown_datapoints = 0
rra[1].cdp_prep[1].value = 0.0000000000e+00
rra[1].cdp_prep[1].unknown_datapoints = 0
rra[2].cf = "AVERAGE"
rra[2].rows = 775
rra[2].cur_row = 74
rra[2].pdp_per_row = 24
rra[2].xff = 5.0000000000e-01
rra[2].cdp_prep[0].value = 5.4375483859e+06
rra[2].cdp_prep[0].unknown_datapoints = 0
rra[2].cdp_prep[1].value = 2.1998255954e+06
rra[2].cdp_prep[1].unknown_datapoints = 0
rra[3].cf = "AVERAGE"
rra[3].rows = 797
rra[3].cur_row = 250
rra[3].pdp_per_row = 288
rra[3].xff = 5.0000000000e-01
rra[3].cdp_prep[0].value = 2.4884340098e+07
rra[3].cdp_prep[0].unknown_datapoints = 0
rra[3].cdp_prep[1].value = 8.5183914983e+06
rra[3].cdp_prep[1].unknown_datapoints = 0
rra[4].cf = "MAX"
rra[4].rows = 600
rra[4].cur_row = 555
rra[4].pdp_per_row = 1
rra[4].xff = 5.0000000000e-01
rra[4].cdp_prep[0].value = NaN
rra[4].cdp_prep[0].unknown_datapoints = 0
rra[4].cdp_prep[1].value = NaN
rra[4].cdp_prep[1].unknown_datapoints = 0
rra[5].cf = "MAX"
rra[5].rows = 700
rra[5].cur_row = 328
rra[5].pdp_per_row = 6
rra[5].xff = 5.0000000000e-01
rra[5].cdp_prep[0].value = -inf
rra[5].cdp_prep[0].unknown_datapoints = 0
rra[5].cdp_prep[1].value = -inf
rra[5].cdp_prep[1].unknown_datapoints = 0
rra[6].cf = "MAX"
rra[6].rows = 775
rra[6].cur_row = 530
rra[6].pdp_per_row = 24
rra[6].xff = 5.0000000000e-01
rra[6].cdp_prep[0].value = 1.4701618228e+06
rra[6].cdp_prep[0].unknown_datapoints = 0
rra[6].cdp_prep[1].value = 3.7781759630e+05
rra[6].cdp_prep[1].unknown_datapoints = 0
rra[7].cf = "MAX"
rra[7].rows = 797
rra[7].cur_row = 694
rra[7].pdp_per_row = 288
rra[7].xff = 5.0000000000e-01
rra[7].cdp_prep[0].value = 2.3122971577e+06
rra[7].cdp_prep[0].unknown_datapoints = 0
rra[7].cdp_prep[1].value = 6.2837038061e+05
rra[7].cdp_prep[1].unknown_datapoints = 0
rrdtool tune แก้ไขคุณลักษณะพื้นฐานของ rrdtool ไฟล์ เช่นเปลี่ยนค่า max ของ data source
rrdtool tune cmu_mis_1_traffic_in_220.rrd --maximum traffic_in:10000000000ดูรายละเอียดเพิ่มเติมที่ rrdtune
rrdtool fetch /path/to/file CF [option] ใช้สำหรับดึงข้อมูลจาก rrdtool โดยสามารถกำหนดช่วงเวลาและความละเอียดของข้อมูลที่จะดึงเช่น
เช่นดึงข้อมูล 1 ชั่วโมงล่าสุด รายละเอียดเพิ่มเติม rrdfetch
rrdtool fetch cmu_mis_1_traffic_in_220.rrd AVERAGE -s -1h
                     traffic_in         traffic_out

1483938300: 4.7878977392e+05 2.2948069908e+04
1483938600: 4.6303544177e+05 1.8144105916e+04
1483938900: 5.7049617789e+05 3.4381264233e+04
1483939200: 1.4363576793e+05 9.4188391805e+03
1483939500: 1.3746872511e+05 7.1482584268e+03
1483939800: 7.6102433889e+04 5.1350154862e+03
1483940100: 7.6963376254e+04 4.5660090457e+03
1483940400: 2.2389588904e+05 8.3472855015e+03
1483940700: 8.0357268406e+04 6.6165589744e+03
1483941000: 7.9354790592e+04 5.1676141294e+03
1483941300: 7.7381791439e+04 5.3697185476e+03
1483941600: 1.1011794797e+05 5.8690860297e+03
1483941900: -nan -nan
rrdtoo xport สำหรับการส่งออกข้อมูลเป็น XML หรือ JSON โดยกำหนดค่าต่าง ๆ ที่จะ xport ลักษณะเดียวกันกับ rrdtool graph เช่น
ส่งออกข้อมูลหนึ่งชั่งโมงที่แล้วของ traffic บน interface หนึ่ง รายละเอียดเพิ่มเติม rrdxport
rrdtool xport \
> --start -1h --end now \
> DEF:in=cmu_mis_1_traffic_in_220.rrd:traffic_in:AVERAGE \
> DEF:out=cmu_mis_1_traffic_in_220.rrd:traffic_out:AVERAGE \
> CDEF:inb=in,8,* \
> CDEF:outb=out,8,* \
> CDEF:sum=inb,outb,+ \
> XPORT:inb:"inboud traffic bits" \
> XPORT:outb:"outbound traffic bits" \
> XPORT:sum:"sum traffic bits"
<?xml version="1.0" encoding="ISO-8859-1"?>

<xport>
  <meta>
    <start>1483941000</start>
    <step>300</step>
    <end>1483941000</end>
    <rows>13</rows>
    <columns>3</columns>
    <legend>
      <entry>inboud traffic bits</entry>
      <entry>outbound traffic bits</entry>
      <entry>sum traffic bits</entry>
    </legend>
  </meta>
  <data>
    <row><t>1483941000</t><v>6.3483832474e+05</v><v>4.1340913035e+04</v><v>6.7617923777e+05</v></row>
    <row><t>1483941300</t><v>6.1905433151e+05</v><v>4.2957748381e+04</v><v>6.6201207989e+05</v></row>
    <row><t>1483941600</t><v>8.8094358375e+05</v><v>4.6952688238e+04</v><v>9.2789627199e+05</v></row>
    <row><t>1483941900</t><v>7.7293905867e+05</v><v>4.4393500997e+04</v><v>8.1733255967e+05</v></row>
    <row><t>1483942200</t><v>6.5026368605e+05</v><v>4.8573750071e+04</v><v>6.9883743613e+05</v></row>
    <row><t>1483942500</t><v>8.8296087883e+05</v><v>5.8947372151e+04</v><v>9.4190825099e+05</v></row>
    <row><t>1483942800</t><v>1.4140087788e+06</v><v>5.8672749534e+04</v><v>1.4726815283e+06</v></row>
    <row><t>1483943100</t><v>4.3605659954e+06</v><v>1.7662720107e+05</v><v>4.5371931964e+06</v></row>
    <row><t>1483943400</t><v>1.6980727508e+06</v><v>8.0145663509e+04</v><v>1.7782184143e+06</v></row>
    <row><t>1483943700</t><v>1.1179436283e+06</v><v>7.7099348020e+04</v><v>1.1950429763e+06</v></row>
    <row><t>1483944000</t><v>3.1598481289e+05</v><v>1.6592438133e+05</v><v>4.8190919422e+05</v></row>
    <row><t>1483944300</t><v>6.4002246321e+05</v><v>5.5490625335e+04</v><v>6.9551308854e+05</v></row>
    <row><t>1483944600</t><v>NaN</v><v>NaN</v><v>NaN</v></row>
  </data>
</xport>
หรือ output แบบ json
rrdtool xport \
> --start -1h --end now --json \
> DEF:in=cmu_mis_1_traffic_in_220.rrd:traffic_in:AVERAGE \
> DEF:out=cmu_mis_1_traffic_in_220.rrd:traffic_out:AVERAGE \
> CDEF:inb=in,8,* \
> CDEF:outb=out,8,* \
> CDEF:sum=inb,outb,+ \
> XPORT:inb:"inboud traffic bits" \
> XPORT:outb:"outbound traffic bits" \
> XPORT:sum:"sum traffic bits"
{ about: 'RRDtool xport JSON output',
  meta: {
    start: 1483941600,
    step: 300,
    end: 1483941600,
    legend: [
      'inboud traffic bits',
      'outbound traffic bits',
      'sum traffic bits'
          ]
     },
  data: [
    [ 8.8094358375e+05, 4.6952688238e+04, 9.2789627199e+05 ],
    [ 7.7293905867e+05, 4.4393500997e+04, 8.1733255967e+05 ],
    [ 6.5026368605e+05, 4.8573750071e+04, 6.9883743613e+05 ],
    [ 8.8296087883e+05, 5.8947372151e+04, 9.4190825099e+05 ],
    [ 1.4140087788e+06, 5.8672749534e+04, 1.4726815283e+06 ],
    [ 4.3605659954e+06, 1.7662720107e+05, 4.5371931964e+06 ],
    [ 1.6980727508e+06, 8.0145663509e+04, 1.7782184143e+06 ],
    [ 1.1179436283e+06, 7.7099348020e+04, 1.1950429763e+06 ],
    [ 3.1598481289e+05, 1.6592438133e+05, 4.8190919422e+05 ],
    [ 6.4002246321e+05, 5.5490625335e+04, 6.9551308854e+05 ],
    [ 3.6522159788e+06, 1.7025369186e+05, 3.8224696706e+06 ],
    [ 4.7051387011e+06, 1.7940220014e+05, 4.8845409013e+06 ],
    [ null, null, null  ]
  ]
}
การ Import Template : ยกตัวอย่าง ApacheStats
Cacti สามารถใช้งาน template ที่สร้างไว้แล้วได้ โดย import template เข้ามาไม่ว่าจะเป็น Data Input Method, Data Template, Graph Template, Host Template และ script ต่าง ๆ ยกตัวอย่างการใช้งาน ApacheStats Template
ปรับแต่ง apache เพื่อให้เข้าถึงค่าสถิติได้
- แก้ไขไฟล์ /etc/apache2/mods-enabled/status.conf
        <Location /server-status>
                SetHandler server-status
                Require local
                Require ip [cacti host ip]
        </Location>
- restart apache
service apache2 restart
- ทดสอบเรียกดู apache statistics ผ่าน url http://[host ip]/server-status หรือ http://[host ip]/server-status?auto
root@ubuntu:~# curl  http://10.199.0.85/server-status?auto
Total Accesses: 95
Total kBytes: 670
CPULoad: .121508
Uptime: 716
ReqPerSec: .132682
BytesPerSec: 958.212
BytesPerReq: 7221.89
BusyWorkers: 1
IdleWorkers: 9
Scoreboard: _______.._W_..........................................................................................................................................
ดาวน์โหลดและติดตั้ง ApacheStats
- ไปที่ http://forums.cacti.net/viewtopic.php?t=25227 แล้ว Download File ApacheStats_0.8.2.zip มาที่ /tmp จากนั้น copy file ไปยังห้องที่เก็บ scripts ของ cacti
cd /tmp
curl -O http://myweb.cmu.ac.th/supawit.w/cacti/uninet/ApacheStats_0.8.2.zip
unzip ApacheStats_0.8.2.zip
cp ApacheStats_0.8.2/ss_apache_stats.php /usr/share/cacti/site/scripts/
- ทดสอบ script
php /usr/share/cacti/site/scripts/ss_apache_stats.php 10.199.0.85
apache_total_hits:241 apache_total_kbytes:1949 apache_cpuload:.115689 apache_busy_workers:1 apache_idle_workers:9 thread_W:9 threadS:0 threadR:0 threadW:1 threadK:0 threadD:0 threadC:0 threadL:0 threadG:0 threadI:0 thread_O:140
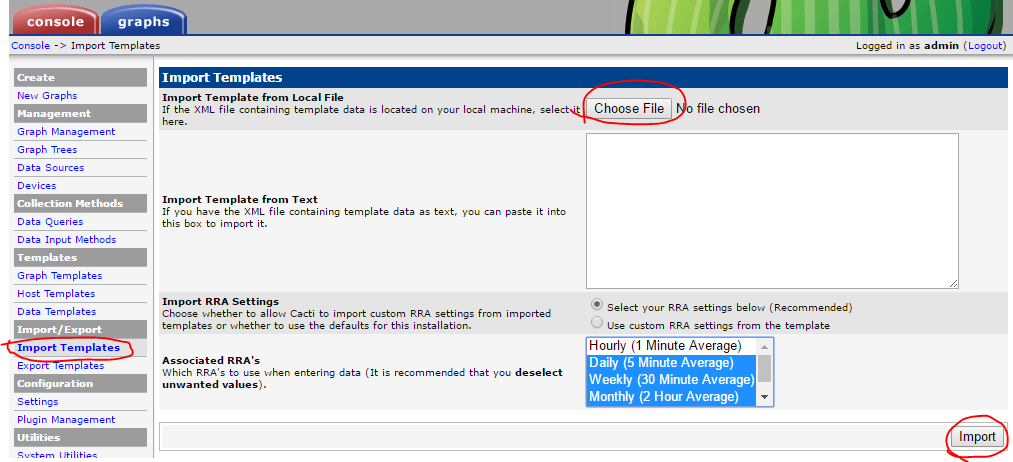
- Import Template ไปที่เมนู Import Template แล้ว Choose File โดยเลือกไฟล์ cacti_host_template_webserver_-_apache.xml ที่อยู่ใน ApacheStats_0.8.2.zip
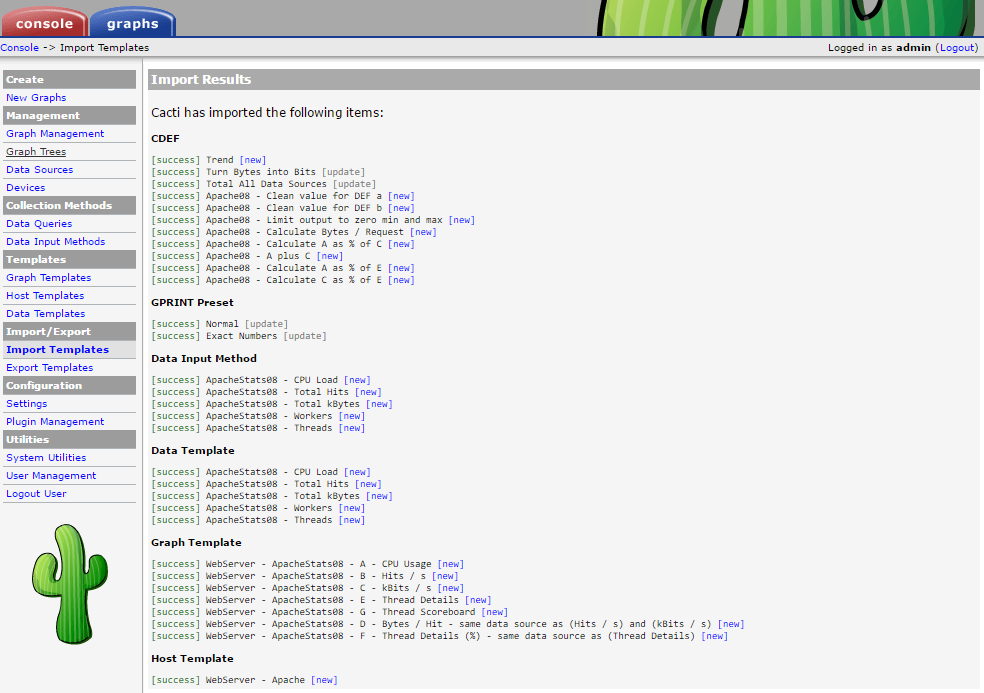
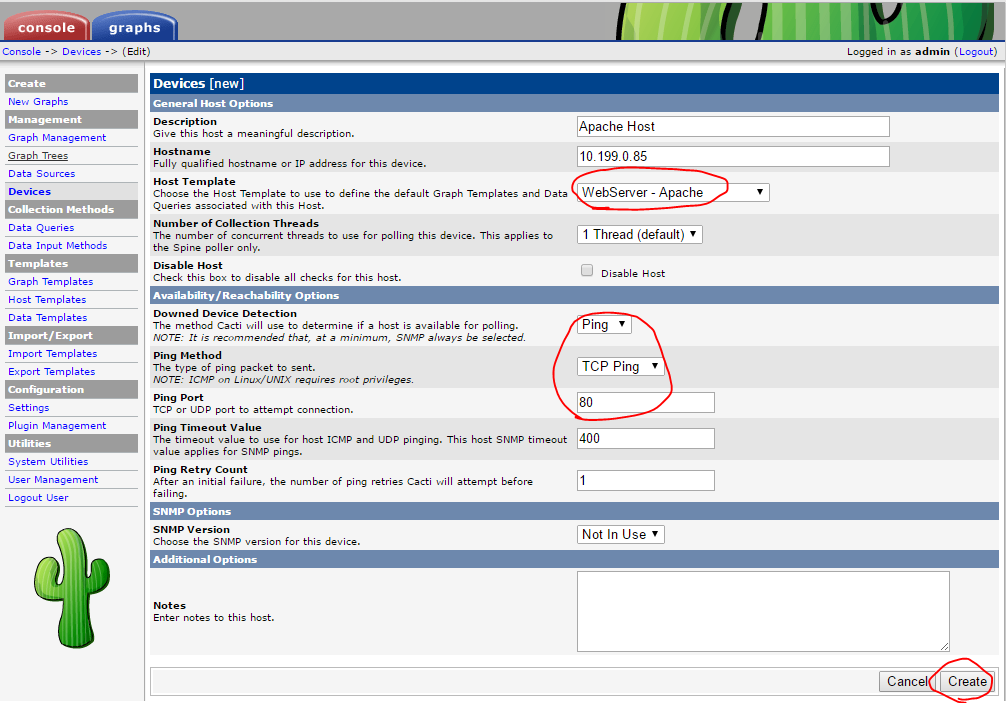
- เพิ่ม Device ใหม่โดยใช้ Host Template เป็น WebServer - Apache
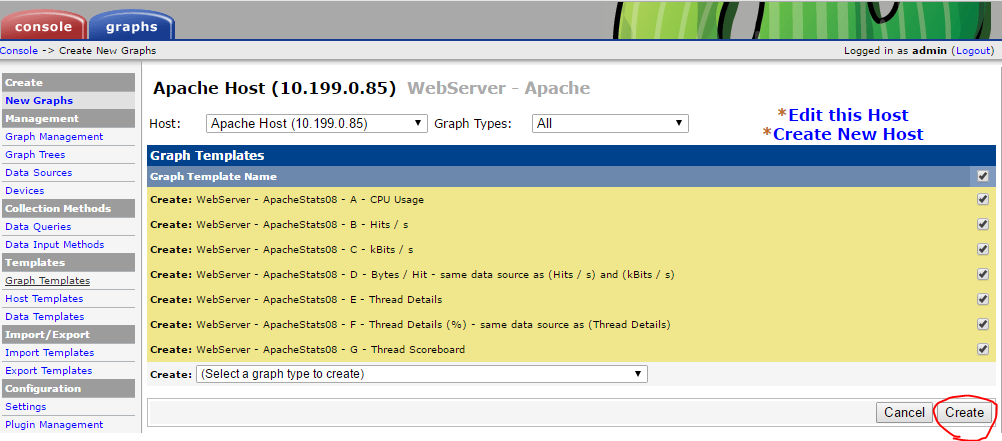
- สร้างกราฟที่ต้องการ
- เพิ่ม Device ลงใน tree

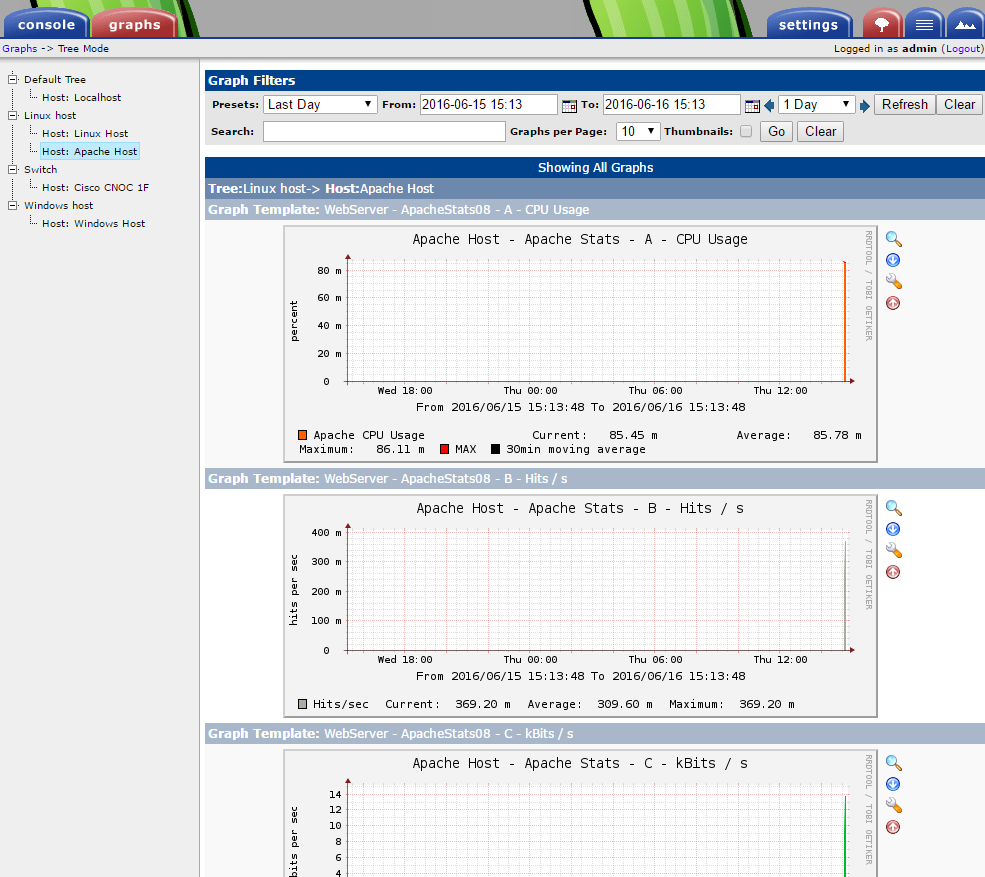
- ดูกราฟ
สร้าง folder layout สำหรับติดตั้ง plugins
mkdir -p /usr/local/share/cacti/plugins
mv /usr/share/cacti/site/plugins/* /usr/local/share/cacti/plugins/
rmdir /usr/share/cacti/site/plugins
ln -s /usr/local/share/cacti/plugins /usr/share/cacti/site/plugins
ln -s /usr/share/cacti/site/include /usr/local/share/cacti/include
ln -s /usr/share/cacti/site/lib /usr/local/share/cacti/lib
ปรับแต่ง postfix mail server สำหรับส่งอีเมล
ติดตั้ง postfix
apt-get install postfix
ใช้ gmail หรือ hotmail เป็น relay host
โดยปกติหน่วยงานที่มีระบบอีเมลเป็นของตัวเองก็สามารถใช้อีเมลภายในหน่สยงานได้ กรณีต้องการใช้ MTA ภายนอกเช่น gmail หรือ hotmail ก็สามารถทำได้ซึ่งจะสามารถส่งได้จำกัดจำนวนฉบับต่อวัน smtp server ที่ใช้งานได้คือ ซึ่งใช้งานเป็น smtp บน tls
- smtp.gmail.com:587
- smtp.live.com:587
สร้างไฟล์รหัสผ่านทำหรับ log in เข้าใช้ smtp
- สร้างไฟล์ /etc/postfix/sasl_passwd
[smtp host] [email address]:[password]
เช่น
smtp.gmail.com user@gmail.com:passwd
- สร้าง hash ของรหัสผ่านแล้วลบรหัสผ่านแบบ plain text
postmap /etc/postfix/sasl_passwd
rm /etc/postfix/sasl_passwd
chmod 400 /etc/postfix/sasl_passwd.db
- แก้ไขไฟล์ /etc/postfix/main.cf
เพิ่มบรรทัด
smtp_sasl_auth_enable = yes
smtp_sasl_password_maps = hash:/etc/postfix/sasl_passwd
smtp_sasl_security_options = noanonymous
smtp_sasl_tls_security_options = noanonymous
smtp_use_tls = yes
แก้บรรทัด
relayhost = [smtp host]:587
restart postfix
service postfix restart
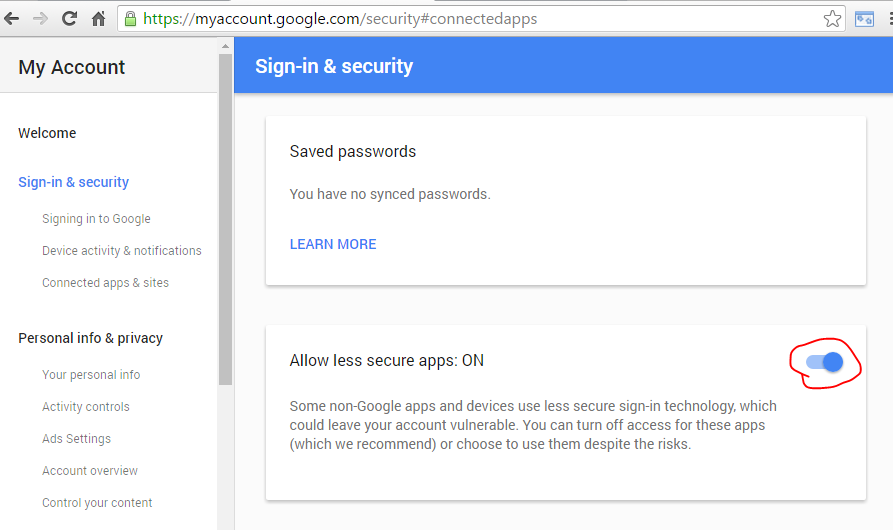
- กรณีใช้ gmail เป็น smtp ต้องไปที่หน้า https://myaccount.google.com/security#connectedapps เพื่อเปิดใช้งาน less secure app
cacti plugin : settings
เป็น plugin พื้นฐานในการตั้งค่าต่าง ๆ เพิ่มเติมเช่นส่งอีเมล Download plugin http://docs.cacti.net/plugin:settings
ติดตั้ง
cd /tmp
curl -O http://myweb.cmu.ac.th/supawit.w/cacti/uninet/settings-v0.71-1.tgz
tar zxvf settings-v0.71-1.tgz
mv settings /usr/local/share/cacti/plugins/
เปิดใช้งาน
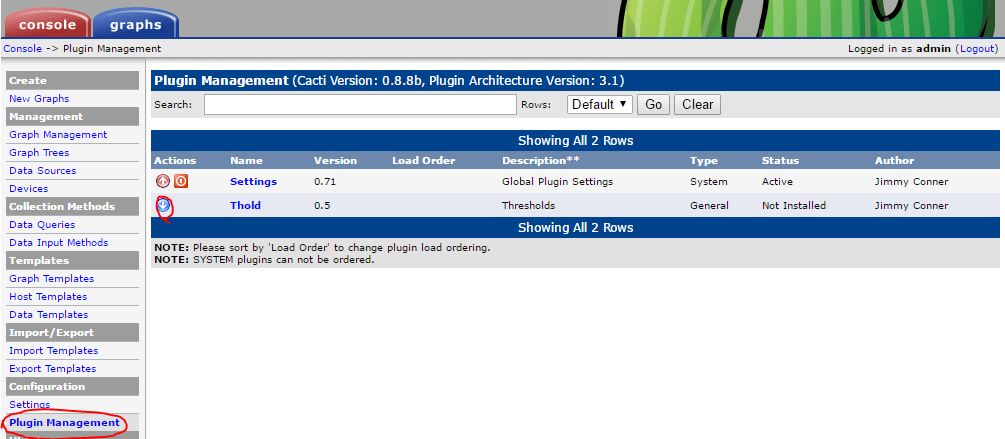
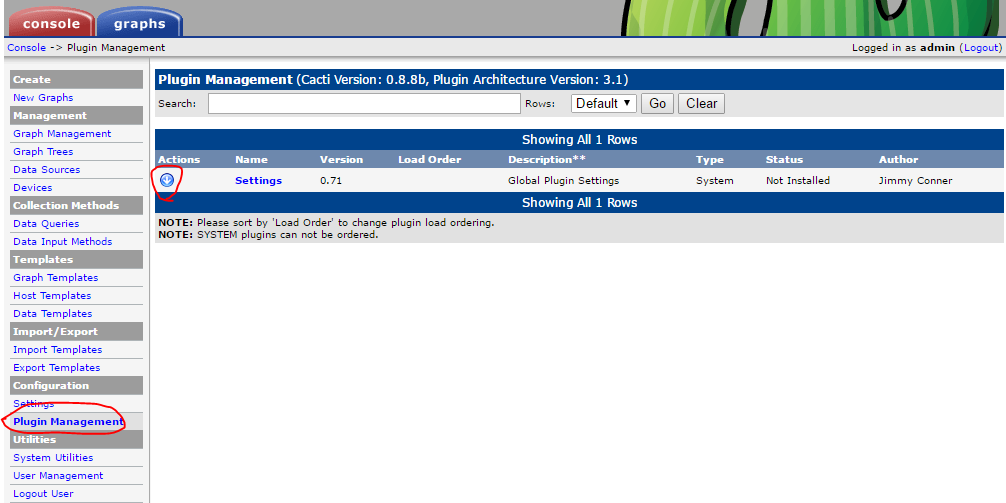
- ที่เมนู Plugin Management จะเห็น plugin ที่ติดตั้ง ให้คลิก Install และ Enable Plugin

ตั้งค่าอีเมล
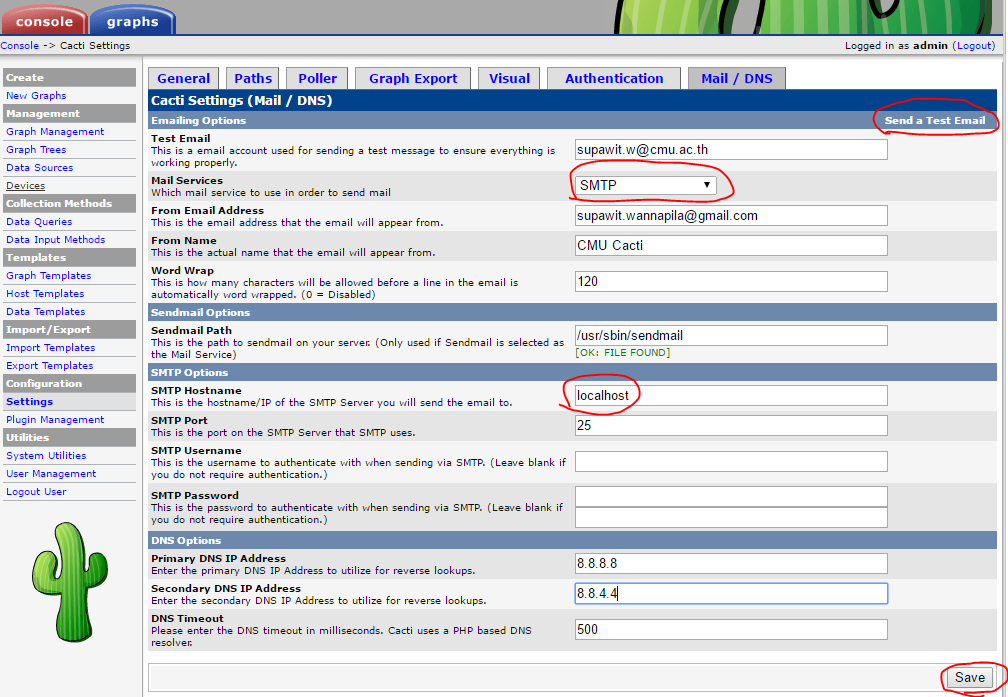
- ที่เมนู Settings แท็บ Mail / DNS ให้ระบุค่าเกี่ยวกับ Email server และ DNS server จากนั้นกด Save และทดสอบส่งอีเมลโดยคลิกที่ Send a Test Email
cacti plugin : thold
เป็น plugin สำหรับแจ้งเตือนเห็นการต่าง ๆ ดาวน์โหลดไฟล์ plugin ได้ที่ http://docs.cacti.net/plugin:thold
ติดตั้ง
cd /tmp
curl -O http://myweb.cmu.ac.th/supawit.w/cacti/uninet/thold-v0.5.0.tgz
tar zxvf thold-v0.5.0.tgz
mv thold /usr/local/share/cacti/plugins/
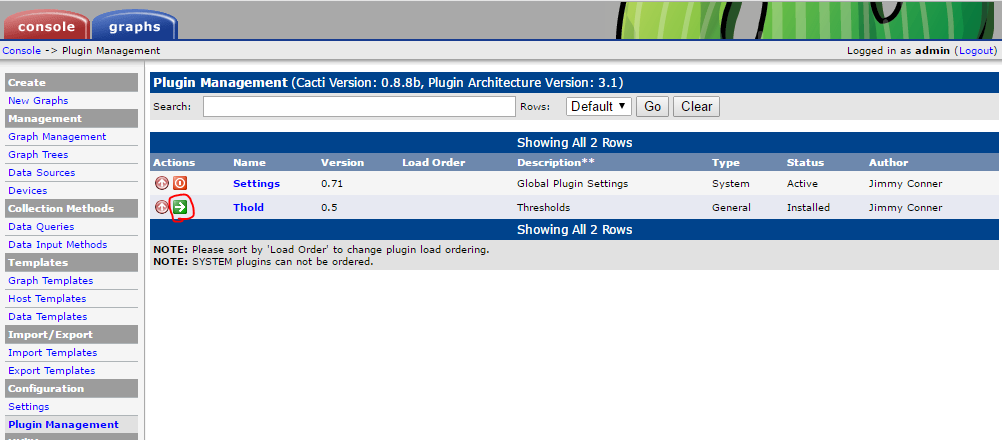
เปิดใช้งาน
- ที่เมนู Plugin Management จะเห็น plugin ที่ติดตั้ง ให้คลิก Install และ Enable Plugin
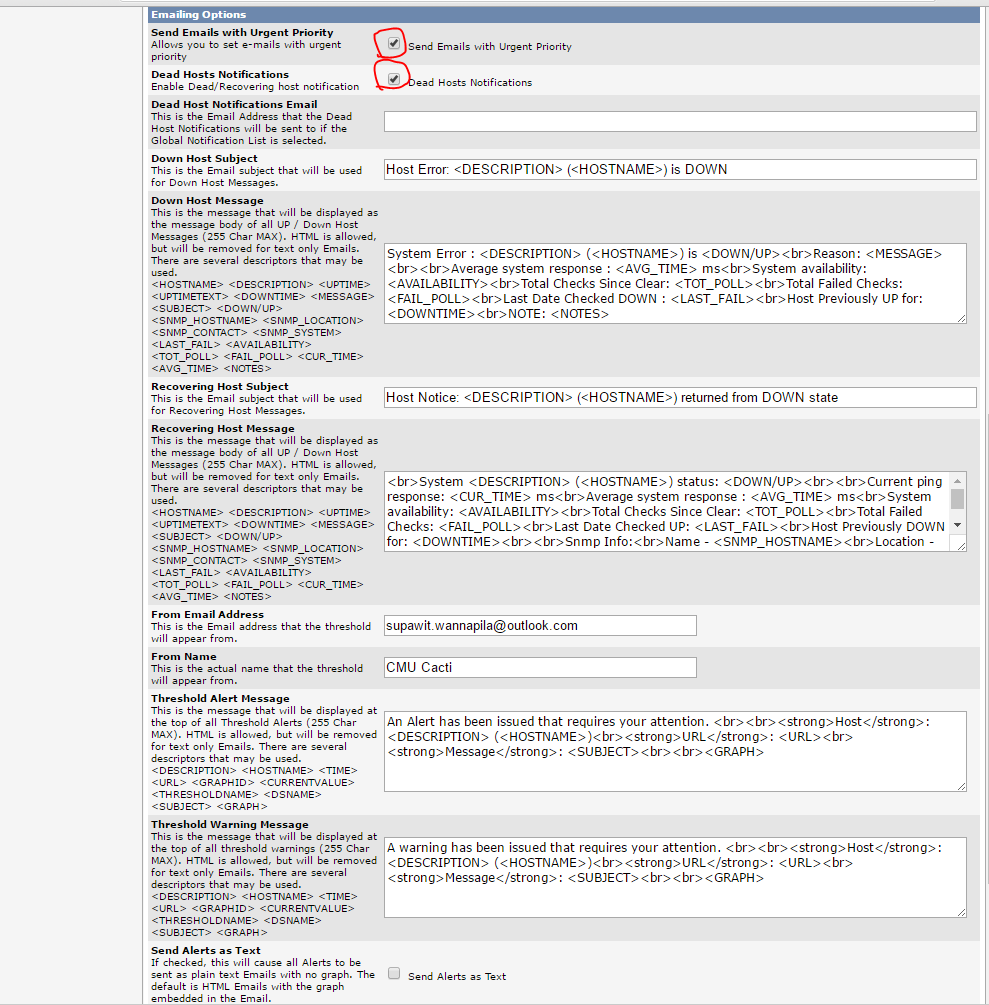
ตั้งค่า thold
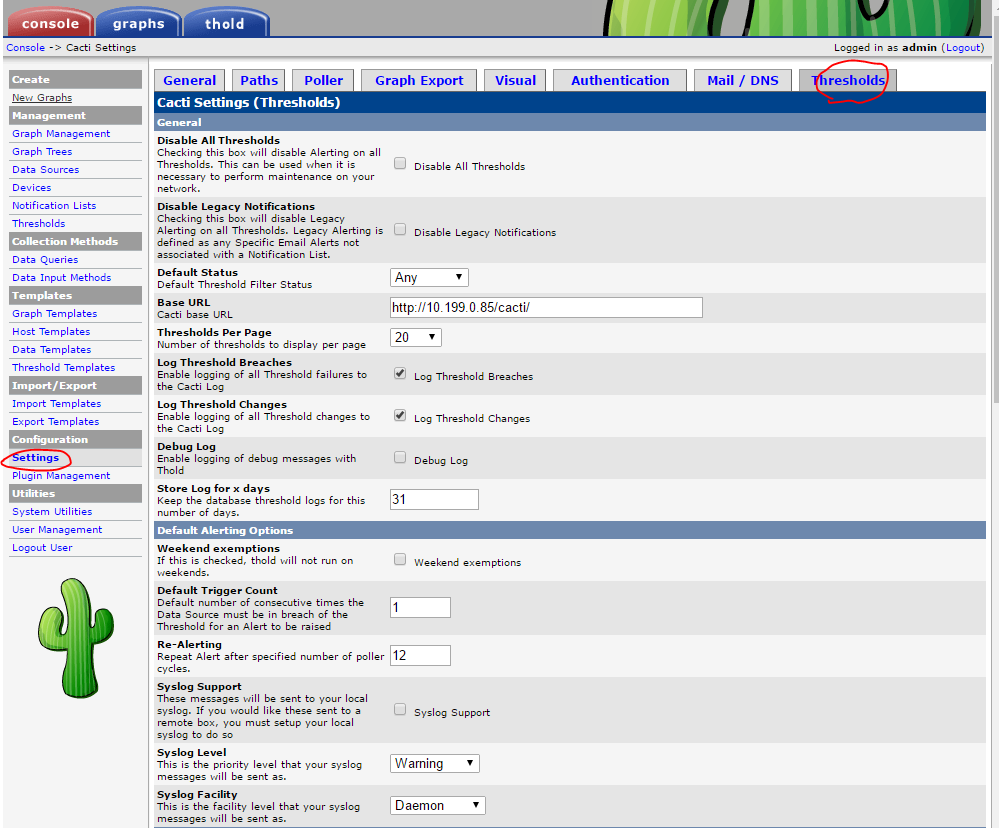
- ที่เมนู Settings แท็บ Thresholds
สร้าง notification list
- ที่เมนู Notification Lists คลิก Add

สร้าง Threshold
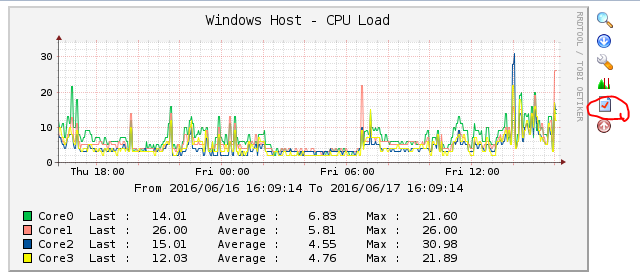
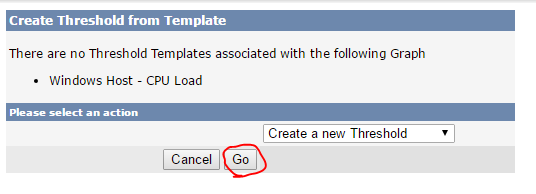
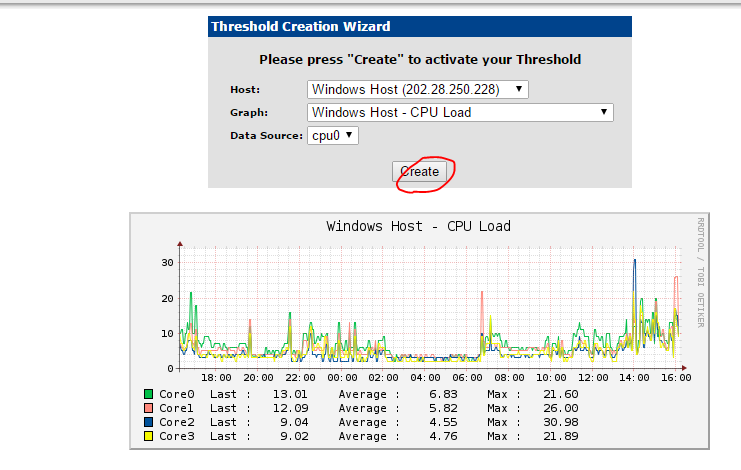
ที่เมนูของกราฟคลิกสร้าง Threshold เลือก Data source ที่จะทำการแจ้งเตือน
กำหนดค่าต่าง ๆ ของ Threshold
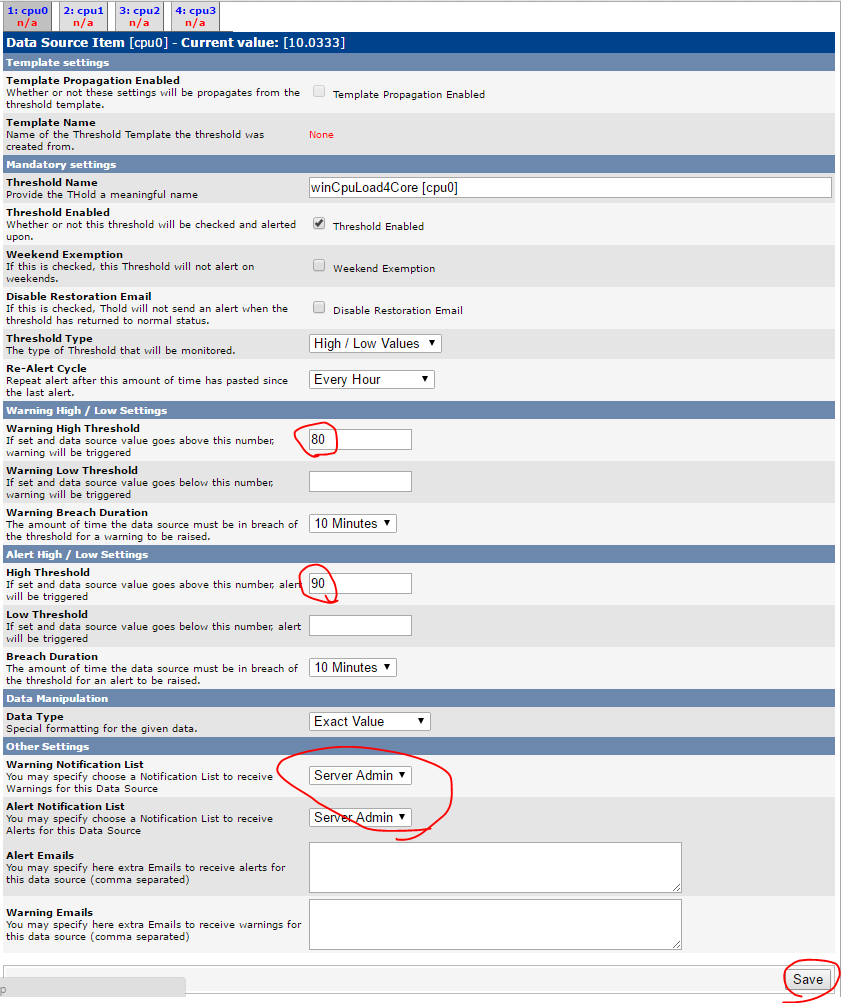
ดู Threshold

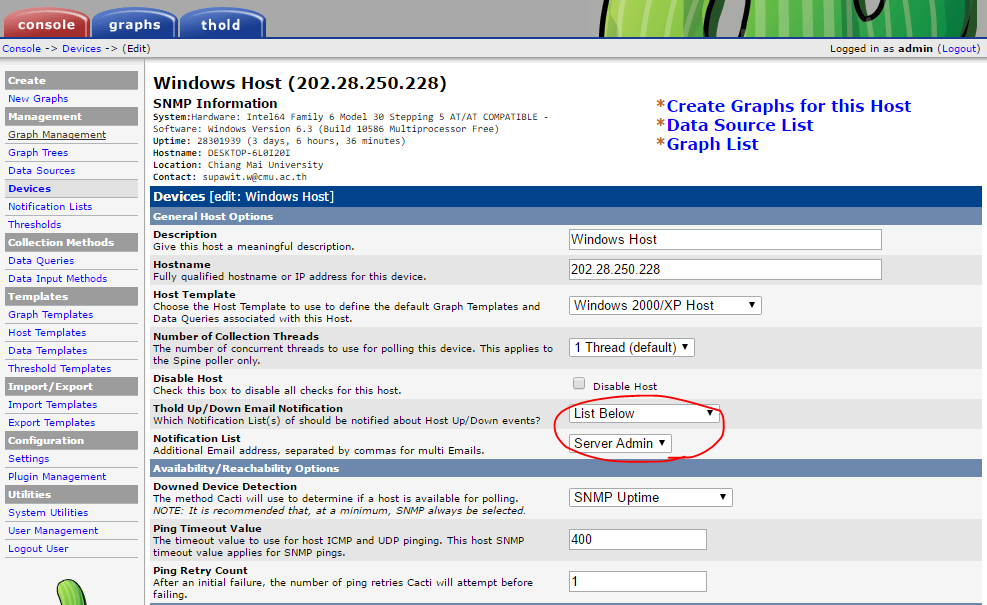
ตั้งค่าให้ Thold แจ้งเตือนเมื่อ Host up/down
ไปที่เมนู Devices เลือกอุปกรณ์ และเลือก notification list ที่จะแจ้งเตือน หรือค่าเริ่มต้นจะเป็น Global List ซึ่งตั้งค่าได้ที่ Settings -> Threshold -> Email Options
cacti plugin : nectar
เป็น plugin ที่ส่ง report ของกราฟต่าง ๆ ให้อัตโนมัติ Download plugin http://docs.cacti.net/plugin:nectar
ติดตั้ง
cd /tmp
curl -O http://myweb.cmu.ac.th/supawit.w/cacti/uninet/nectar-v0.35a.tgz
tar zxvf nectar-v0.35a.tgz
mv nectar /usr/local/share/cacti/plugins/
เปิดใช้งาน
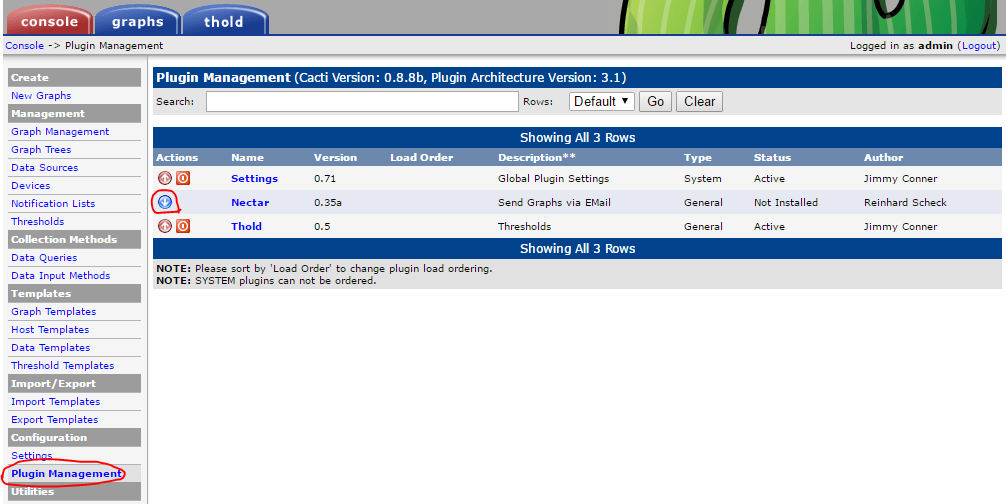
ที่เมนู Plugin Management จะเห็น plugin ที่ติดตั้ง ให้คลิก Install และ Enable Plugin

สร้าง Report
- ที่แท็บ nectar คลิก Add
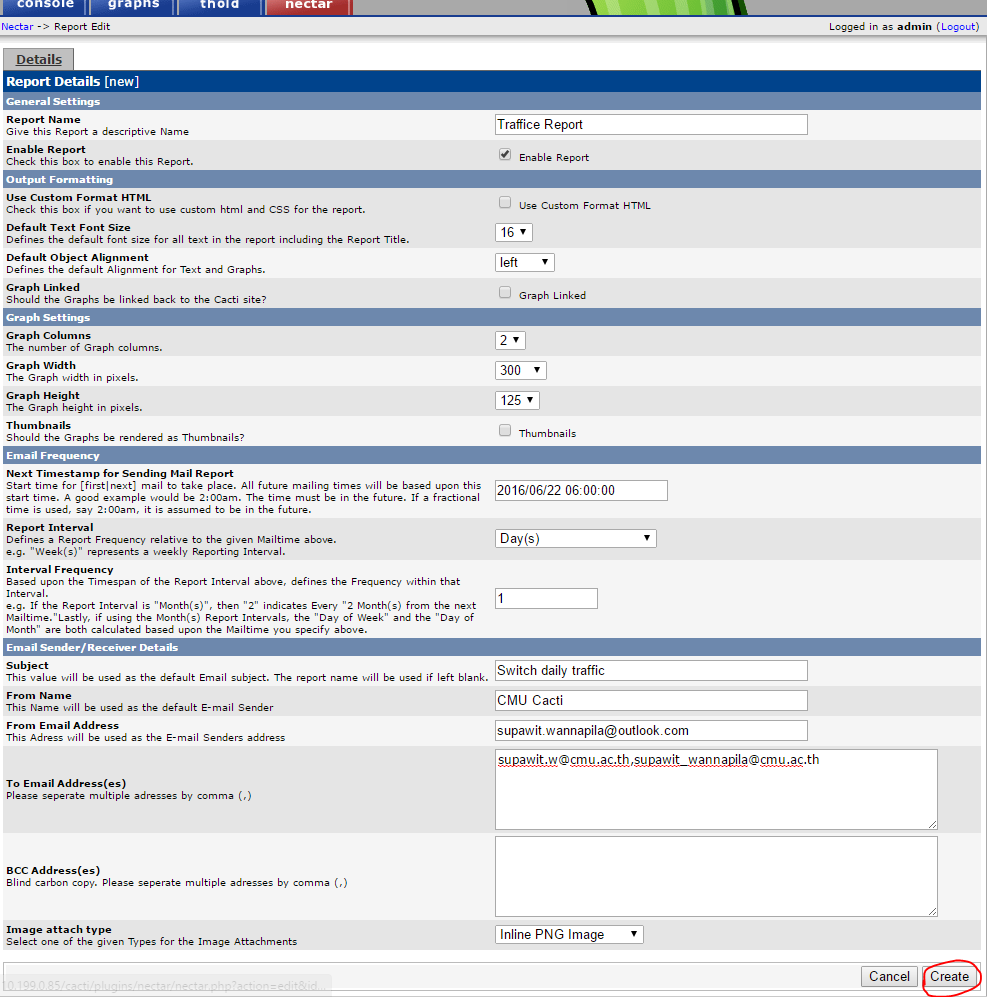
- ตั้งค่าของ Report แล้วคลิก Create
- เพิ่มกราฟเข้าไปใน Report ไปที่แท็บ Items แล้วคลิก Add
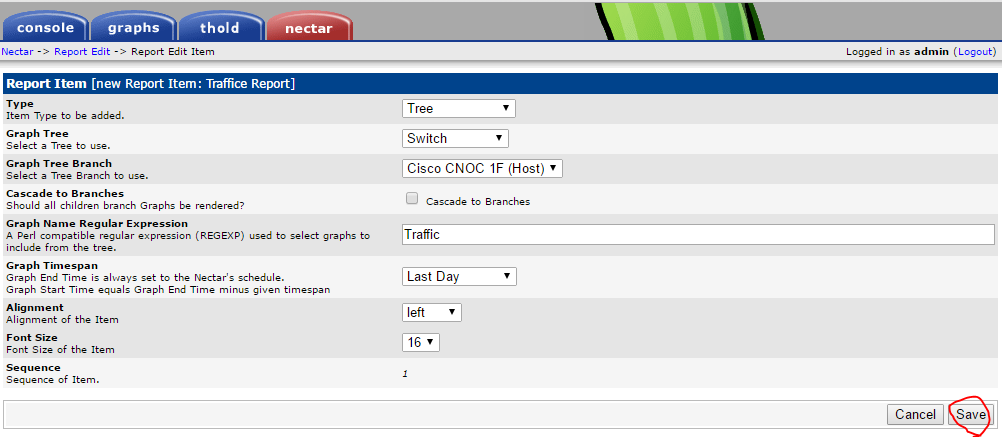
- ระบุรายละเอียดการเลือกกราฟที่จะเพิ่มใน Report สามารถเพิ่มกราฟได้หลายชุดโดยการคลิด Add
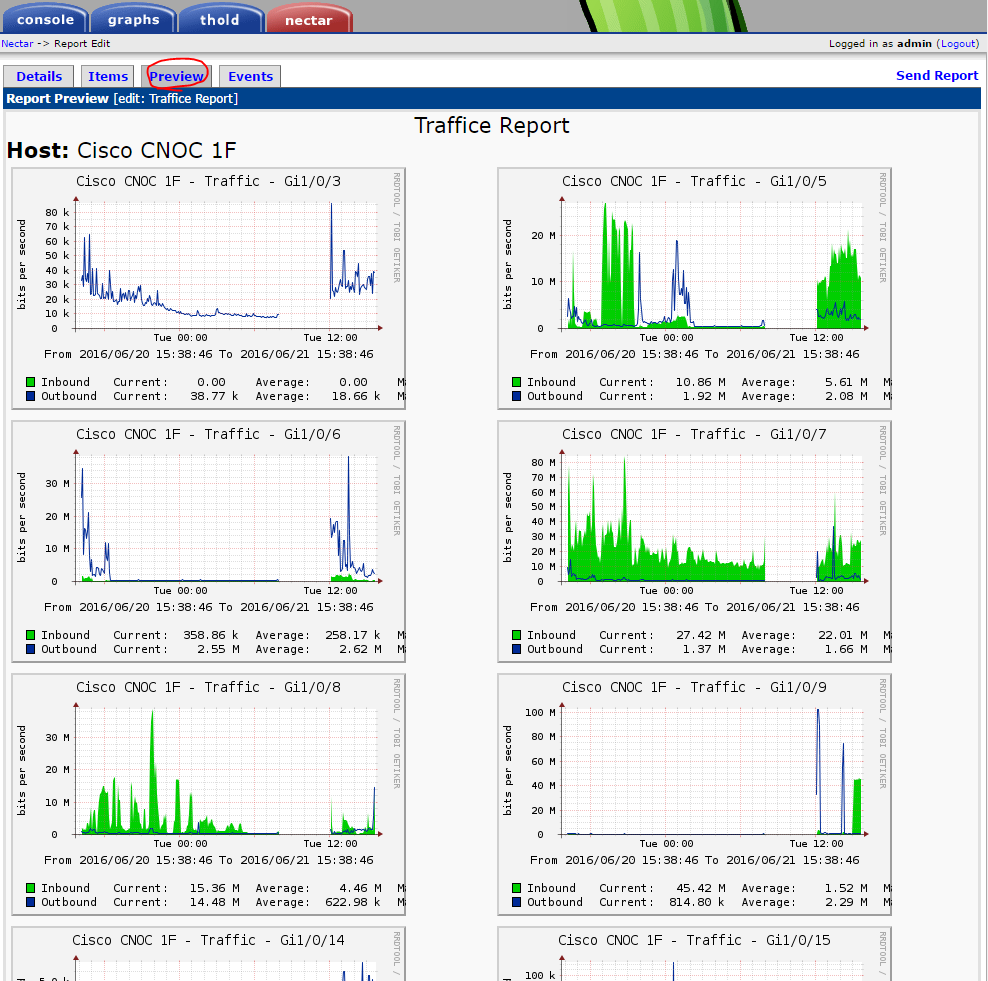
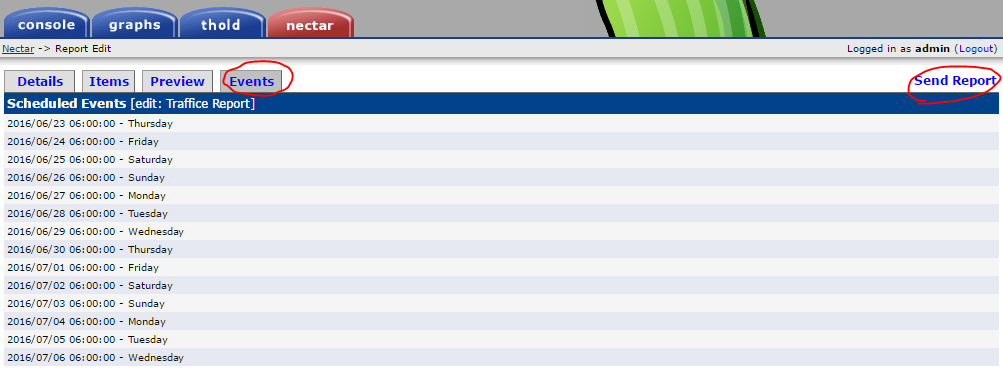
- สามารถคลิก Preview เพื่อดูตัวอย่าง Report, Events เพื่อดูกำหนดการส่ง Report และ Send Report เพื่อส่ง Report ทันที
cacti plugin : weathermap
เป็น plugin ที่สร้างแผนที่/แผนฝังการเชื่อมต่อของอุปกรณ์ต่าง ๆ โดยใช้ข้อมูลจาก cacti เพื่อแสดงข้อมูลแบบ real-time Download plugin http://network-weathermap.com
ติดตั้ง
ทำการติดตั้ง library ที่จำเป็นและตั้งค่า permission ของ directory เพื่อให้สามารถสร้างรูปภาพแผนที่ได้
apt-get install php5-gd
service apache2 restart
cd /tmp
curl -O http://myweb.cmu.ac.th/supawit.w/cacti/uninet/php-weathermap-0.98.zip
unzip php-weathermap-0.98.zip
mv weathermap /usr/local/share/cacti/plugins/
chmod 770 /usr/local/share/cacti/plugins/weathermap/{configs,output}
chgrp www-data /usr/local/share/cacti/plugins/weathermap/{configs,output}
เปิดใช้งาน
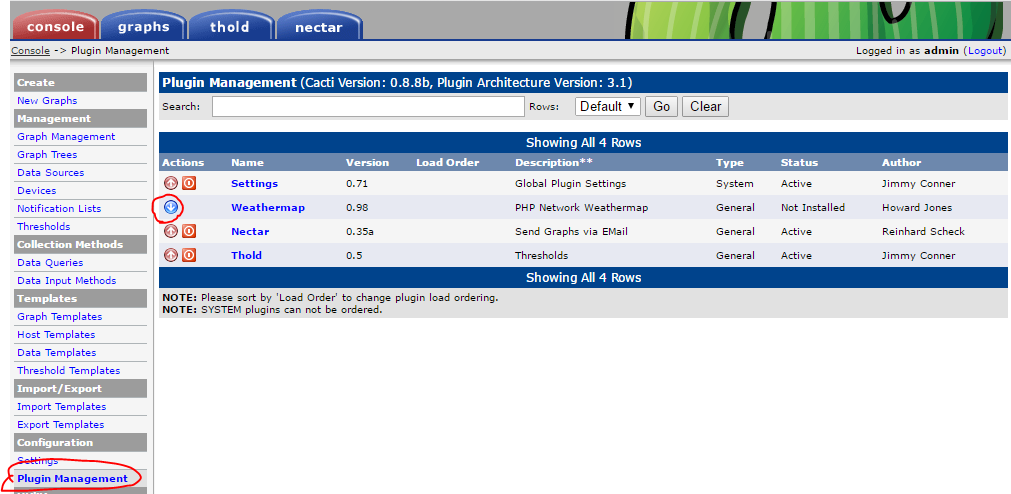
ที่เมนู Plugin Management จะเห็น plugin ที่ติดตั้ง ให้คลิก Install และ Enable Plugin

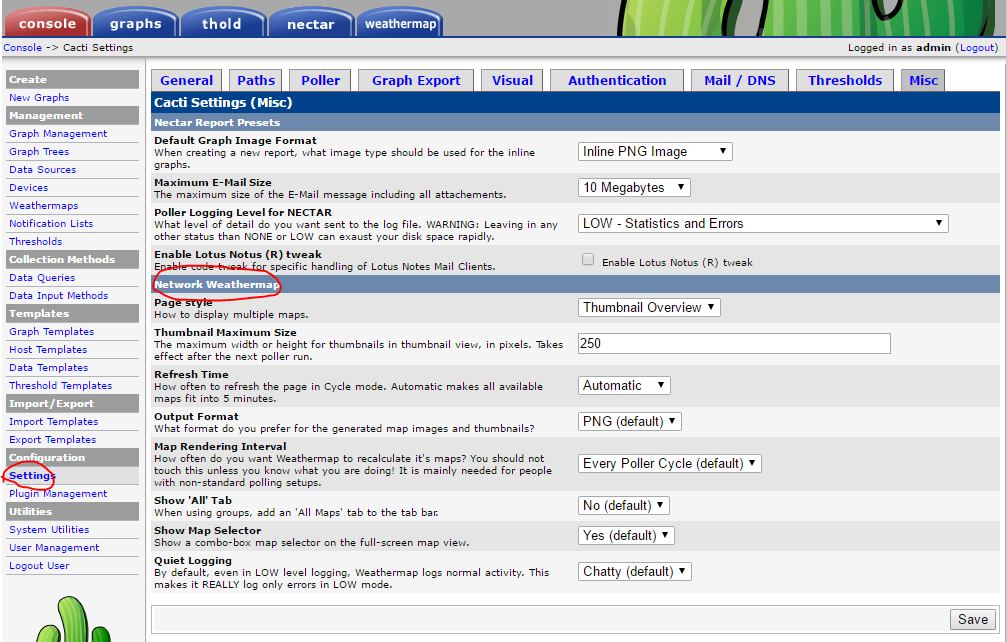
ตั้งค่า
ที่เมนู settings จะมีส่วนของ weathermap เพิ่มขึ้นมา
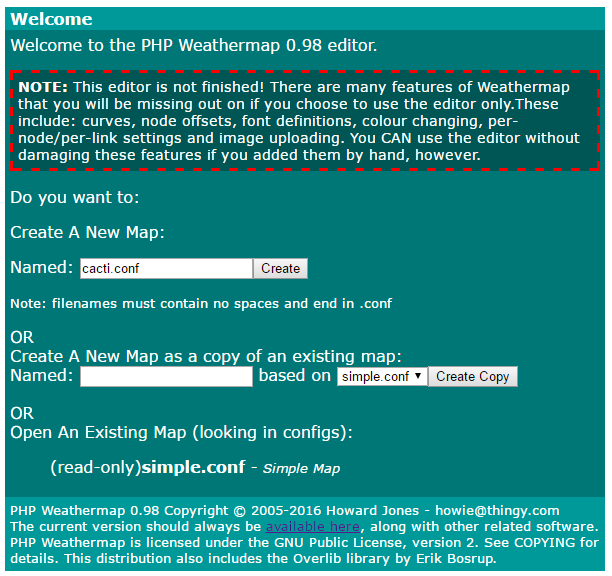
editor
ที่เมนู Weathermaps คลิก Weathermap Editor จากนั้นให้ตั้งชื่อไฟล์ map โดยต้องตั้งนามสกุลไฟล์เป็น .conf เสมอ
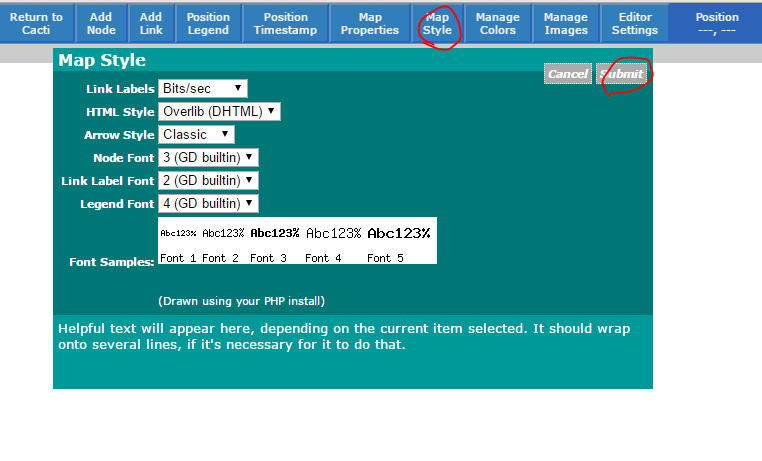
Map Properties and Map Style
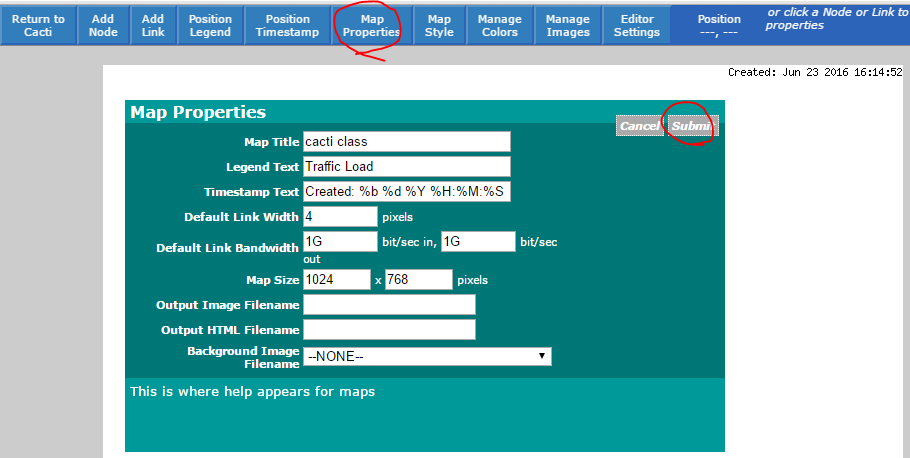
ที่เมนนูของ editor สามารถกำหนดค่าต่าง ๆ ของ map ได้
เพิ่ม map ลง cacti
ที่เมนู Weathermaps คลิก Add แล้วเลือก map ที่ต้องการแล้วคลิก Add
กำหนดให้ทุกคนสามารถเห็น map ได้ที่ Accessible by คลิกที่ admin จากนั้นเลือก Anyone แล้วคลิก Update

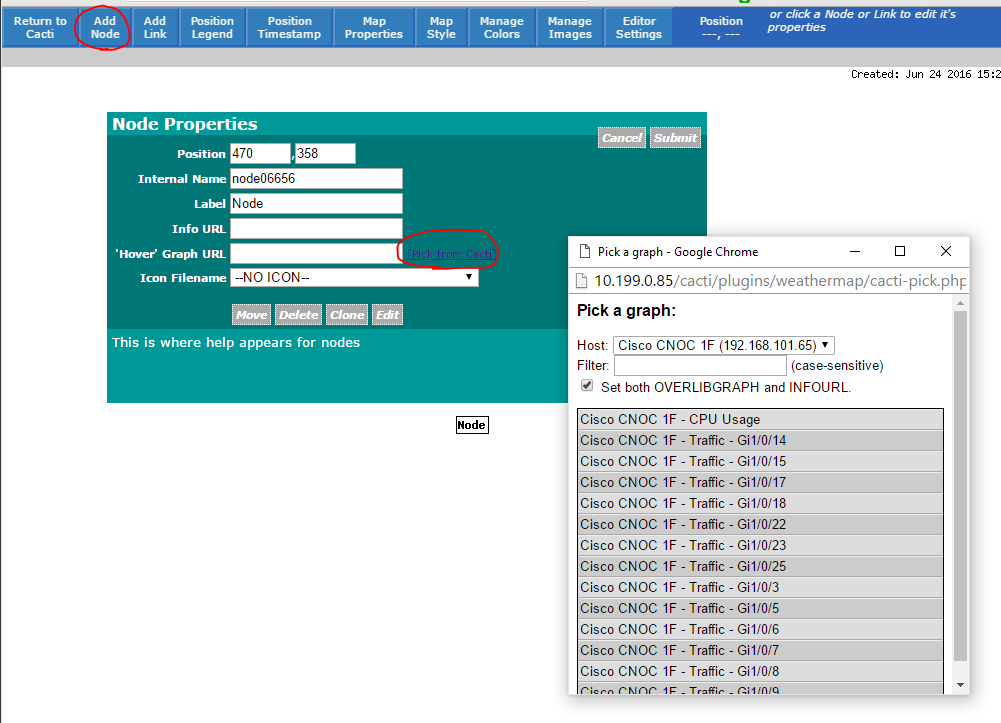
เพิ่ม node
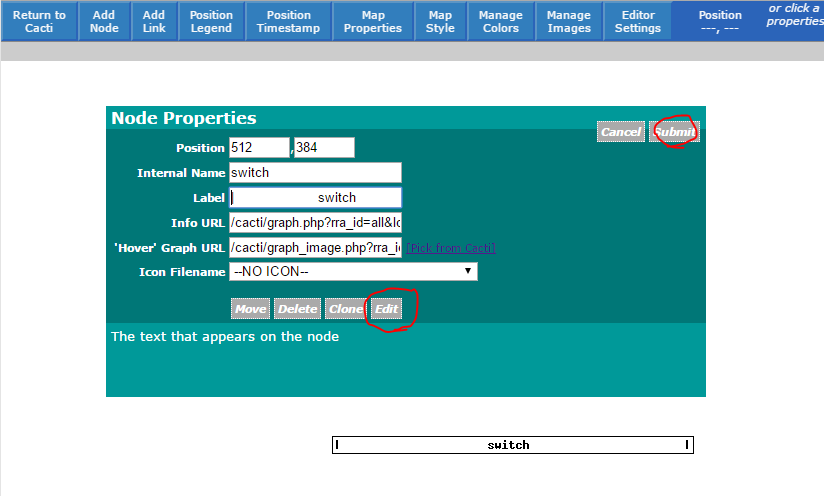
เพิ่มรายละเอียด node สามารถคลิกที่ปุ่ม Edit เพื่อแก้ไข configuration ของ node โดยตรงได้
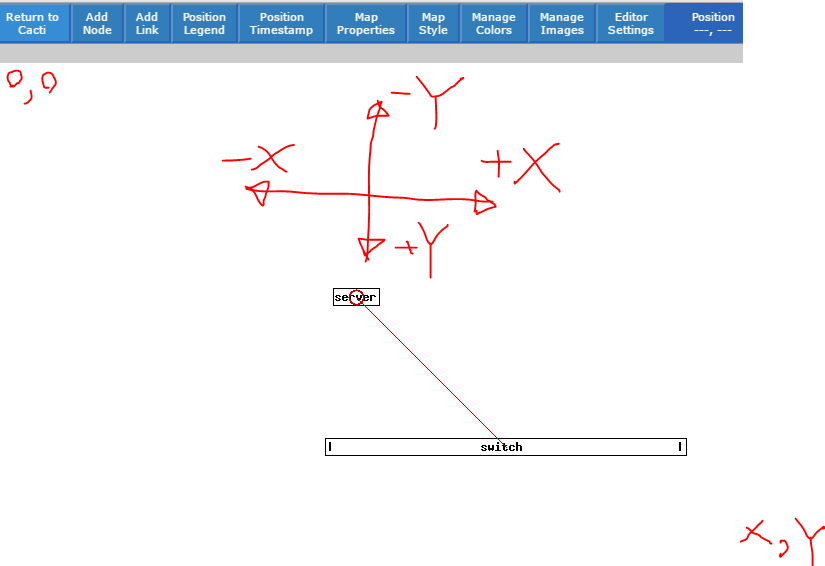
relative position
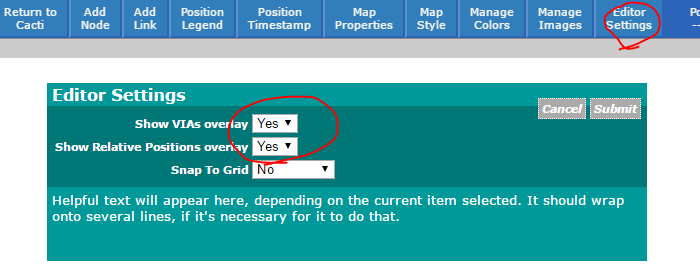
ตั้งค่า Editor ให้แสดงเส้น relative
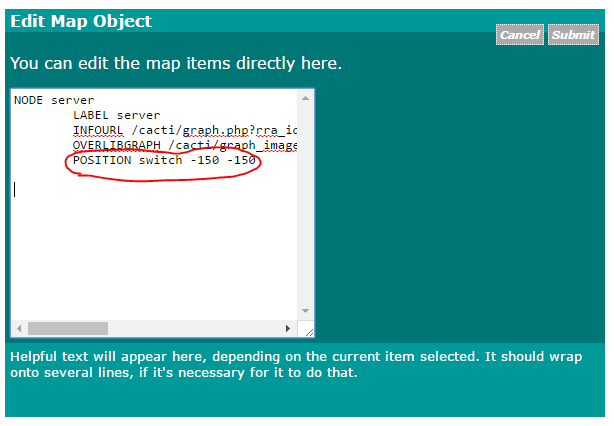
การเพิ่ม node ควรใช้ตำแหน่งของ node ใหม่อ้างอิงจาก node เดิมจะทำให้การแก้ไข map แผนที่ทำได้ง่าย สามารถทำได้โดยแก้ไข configuration ของ node โดยระบุ ชื่อของ node หลัก และระยะห่างจาก node หลักในแกน x และแกน y ตามลำดับ
เพิ่ม link
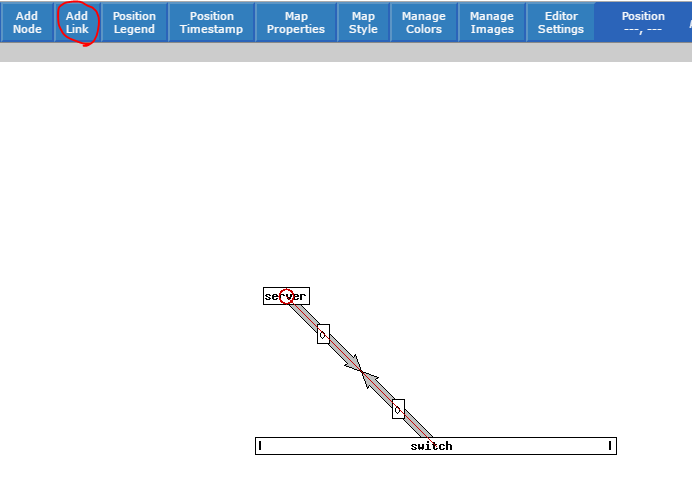
คลิกที่ Add link จากนั้นคลิกที่ node ต้นทางแล้วคลิกที่ node ปลายทาง (ควรให้ node ต้นทางเป็นอุปกรณ์ที่อยู่ขอบ และ node ปลายทางอยู่ core เนื่องจากถ้ามีการเปลี่ยน core จะต้องมาแก้ไข link ทั้งหมด)
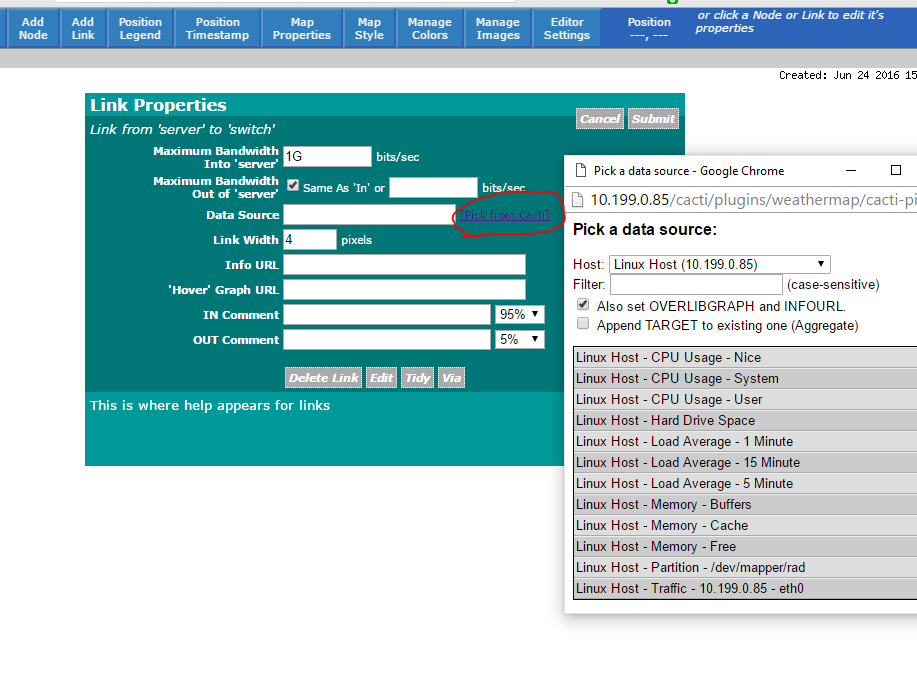
คลิกที่ link จากนั้นเลือกกราฟที่จะใช้แสดงข้อมูลบน link กราฟที่เลือกต้องเป็นกราฟของ node ต้นทาง
Legend and Timestamp
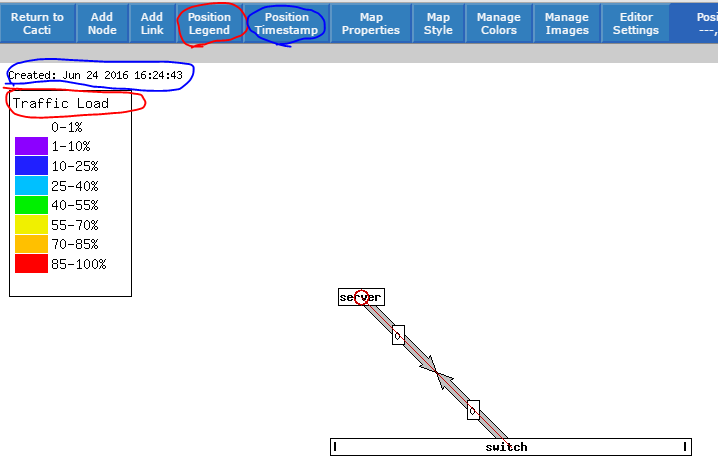
คลิกที่ Position Legend หรือ Position Timestamp แล้วคลิกบนแผนที่เพื่อระบุตำแหน่ง
Edit link
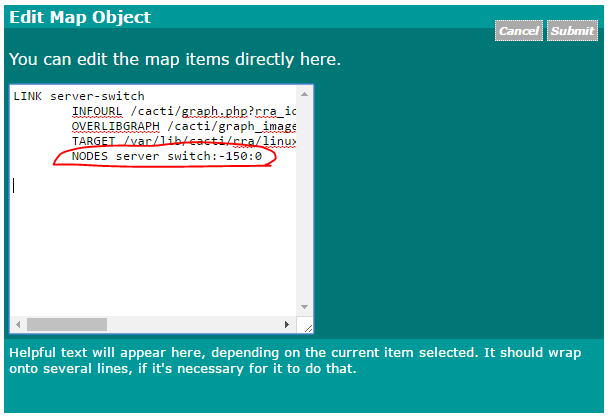
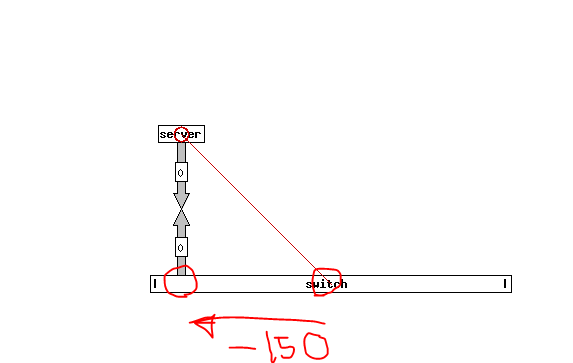
สามารถย้ายจุดกำเนิดของ link ได้โดยระบุ offset ที่ node
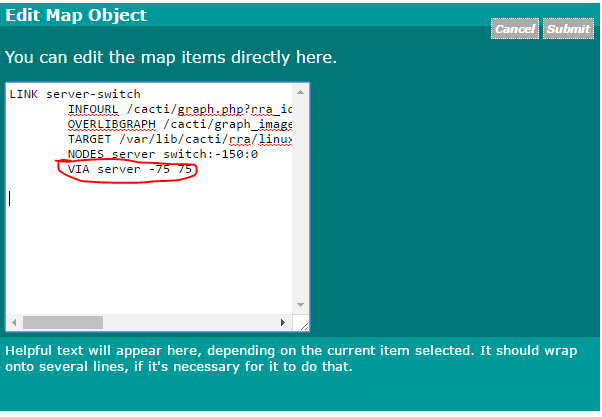
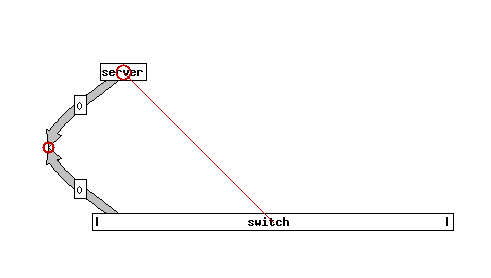
สารมารกำหนดตำแหน่งที่ให้ link ผ่านได้โดยใช้ parameter VIA โดยค่าของตำแหน่งจะเป็น absolute หรือ relative ก็ได้
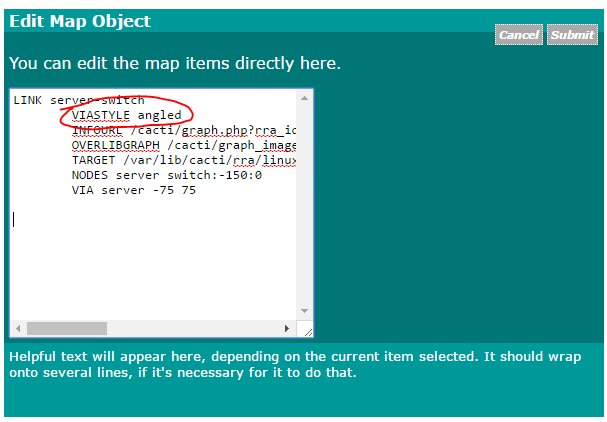
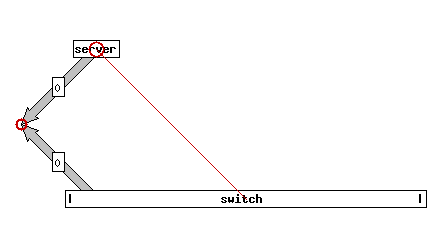
สามารถเปลี่ยนรูปแบบ link ได้โดยใช้ parameter VIASTYLE angled
Host status legend
แก้ไขไฟล์ configuration ของ map /usr/local/share/cacti/plugins/weathermap/configs/cacti.conf
เพิ่มบรรทัดต่อท้าย global section
KEYPOS host 50 50 Host Status
KEYSTYLE host tags 250
SCALE host 0 0.5 192 192 192 Disabled
SCALE host 0.5 1.5 255 128 128 Down
SCALE host 1.5 2.5 128 128 255 Recovering
SCALE host 2.5 3.5 128 255 128 Up

# End of global section
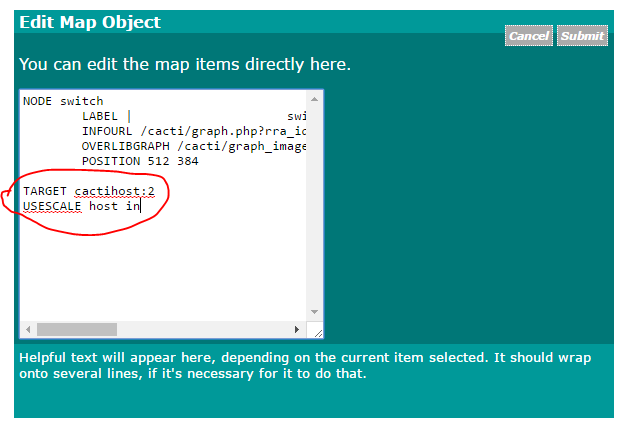
คลิกที่ node เพิ่ม parameter TARGET cactihost:[host id] host id คือ id ของ host ของ cacti และ USESCALE host in host คือชื่อ SCALE ที่ประกาศไว้ในขั้นตอนก่อนหน้า
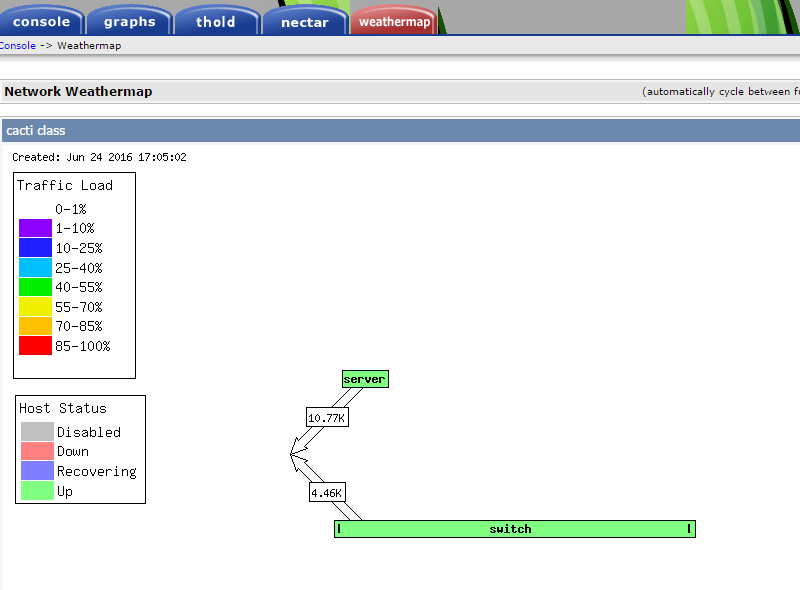
สีของ node จะเปลี่ยนตามสถานะของ host บน cacti
Lab VM image
ผู้เขียน
ศุภวิทย์ วรรณภิละ
CCNA,RHCE
สำนักบริการเทคโนโลยีสารสนเทศ มหาวิทยาลัยเชียงใหม่
supawit.w@cmu.ac.th
